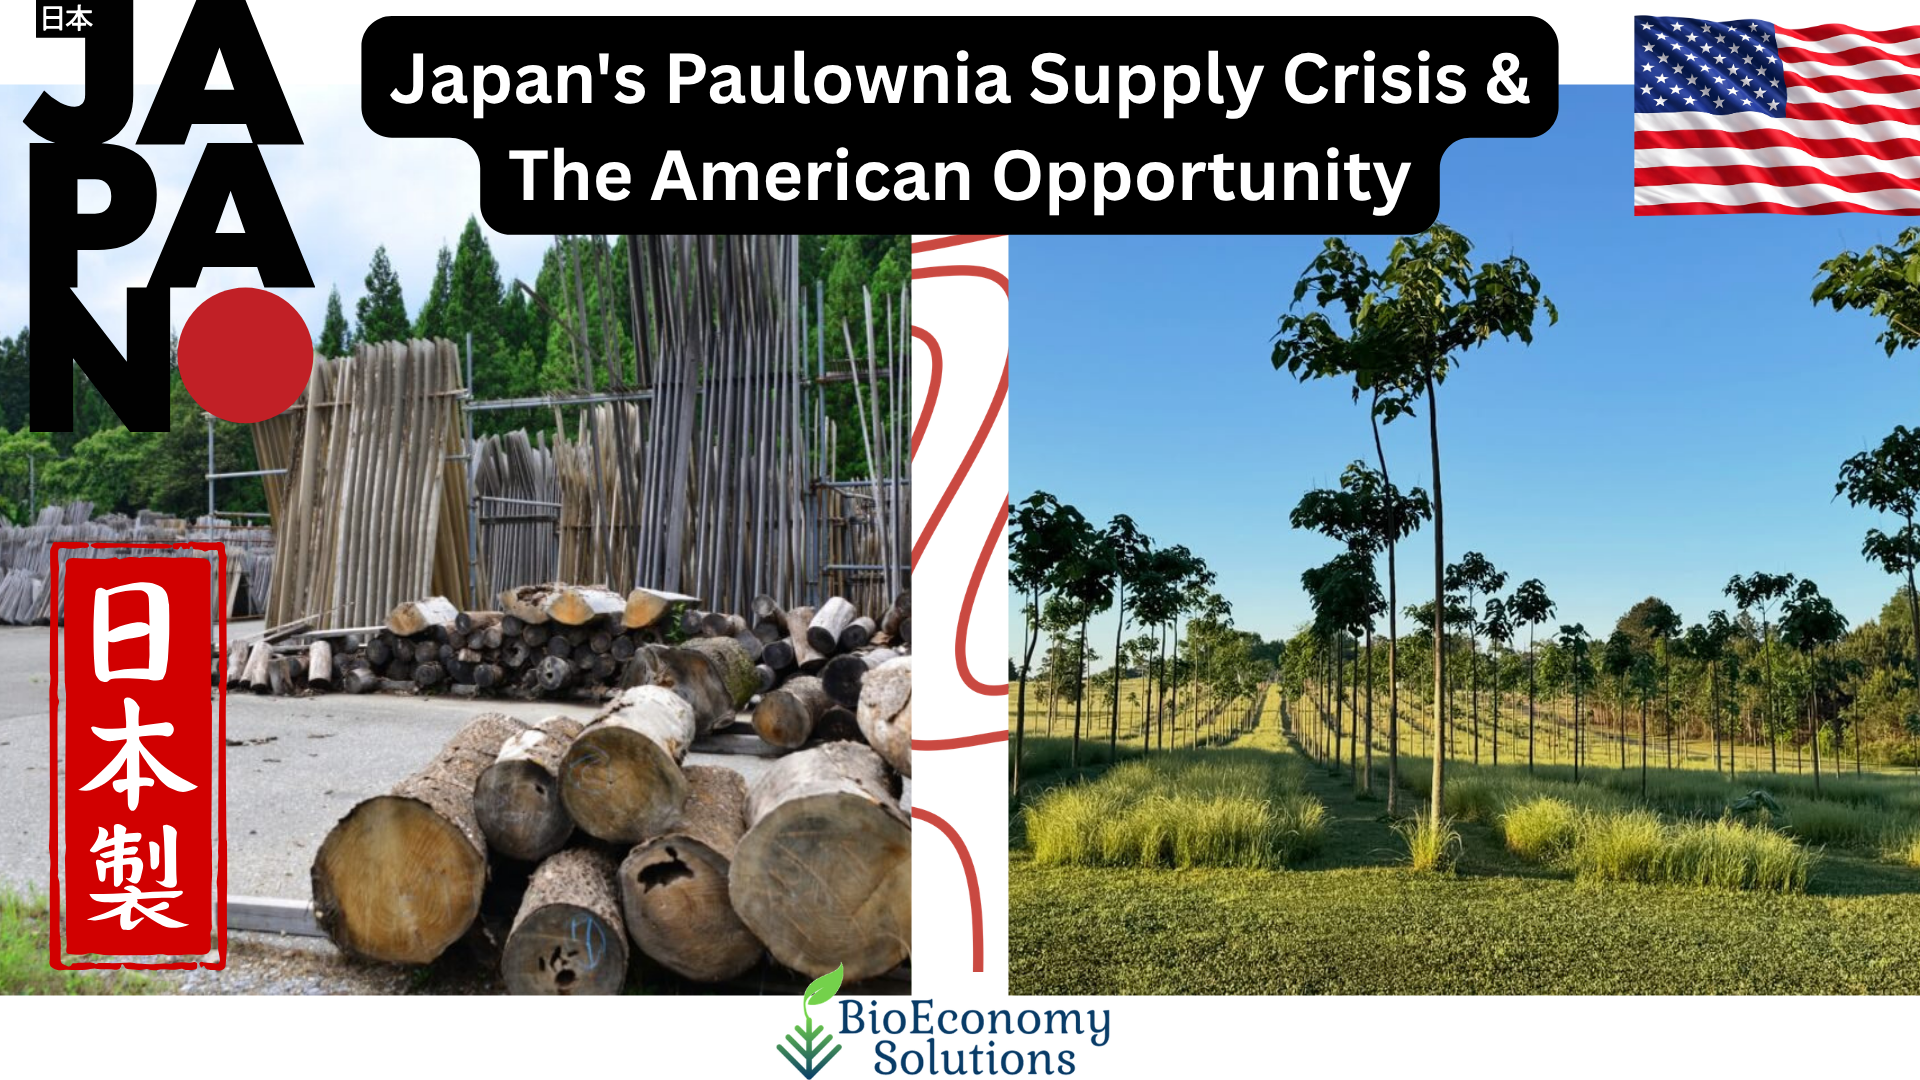
Two Japanese industrial buyers contacted BioEconomy Solutions this month — not through a broker, not through a trade show — directly. Hunting for American paulownia. Willing to talk volume. Willing to talk long-term.
That doesn’t happen by accident.
When one of the world’s most disciplined, quality-obsessed timber markets starts calling a paulownia farm in the American South, something structural has broken in the global supply chain. And the window to position yourself on the right side of that break is closing faster than most people realize.
Here is exactly what is happening — and why it matters to every landowner, carbon developer, and ESG investor paying attention to the bioeconomy right now.
PART A: STAKES — Why Should You Care?
Most people in the American timber and carbon markets have never thought about Japan’s paulownia problem.
That is precisely why this is an opportunity.
Japan is not a casual buyer. When Japanese industrial procurement teams start making direct international calls, it means their domestic supply chain has already failed them. It means their regional brokers have already let them down. It means they are in a structural squeeze — not a seasonal dip — and they need a reliable partner, not a spot-market gamble.
Let’s put the scale of this in context.
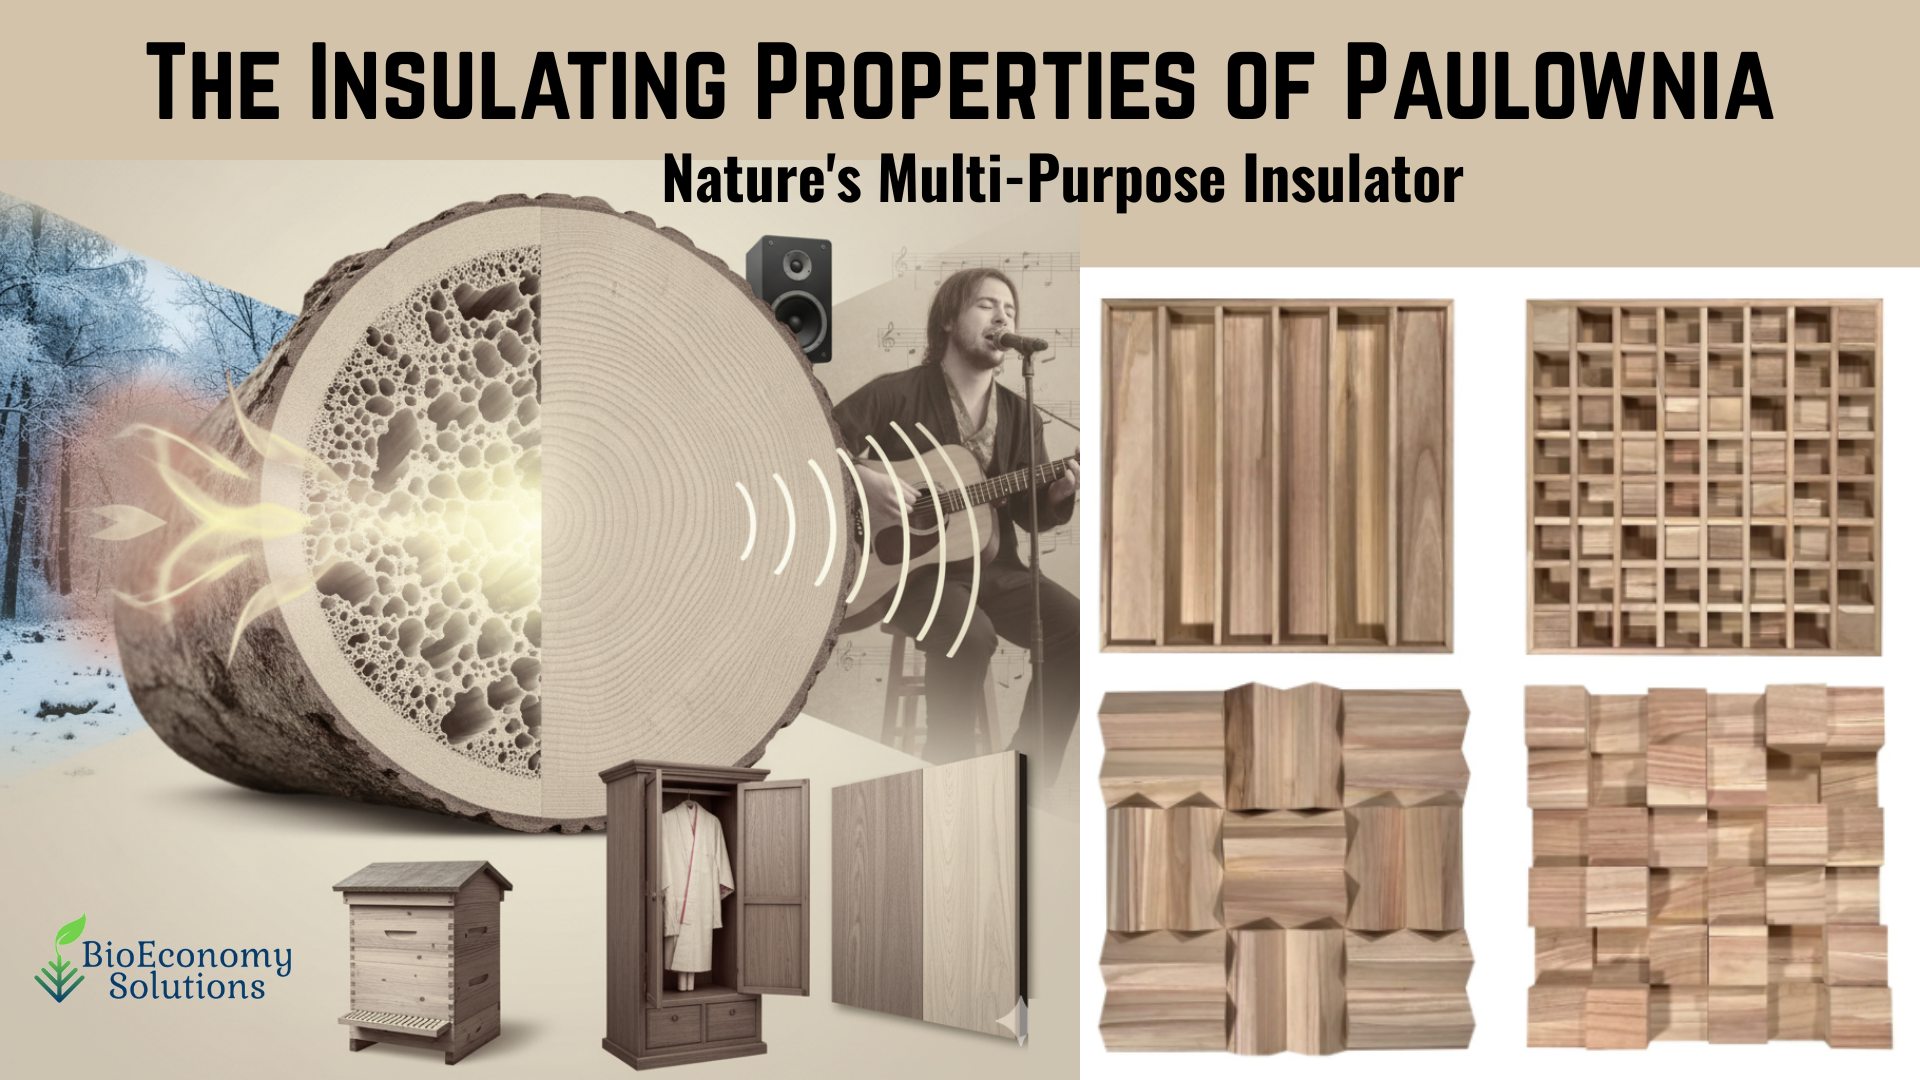
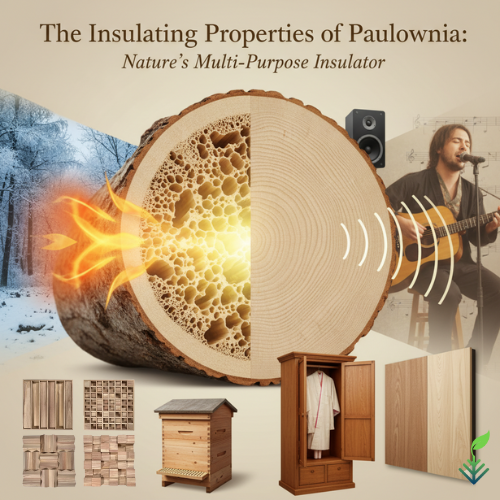
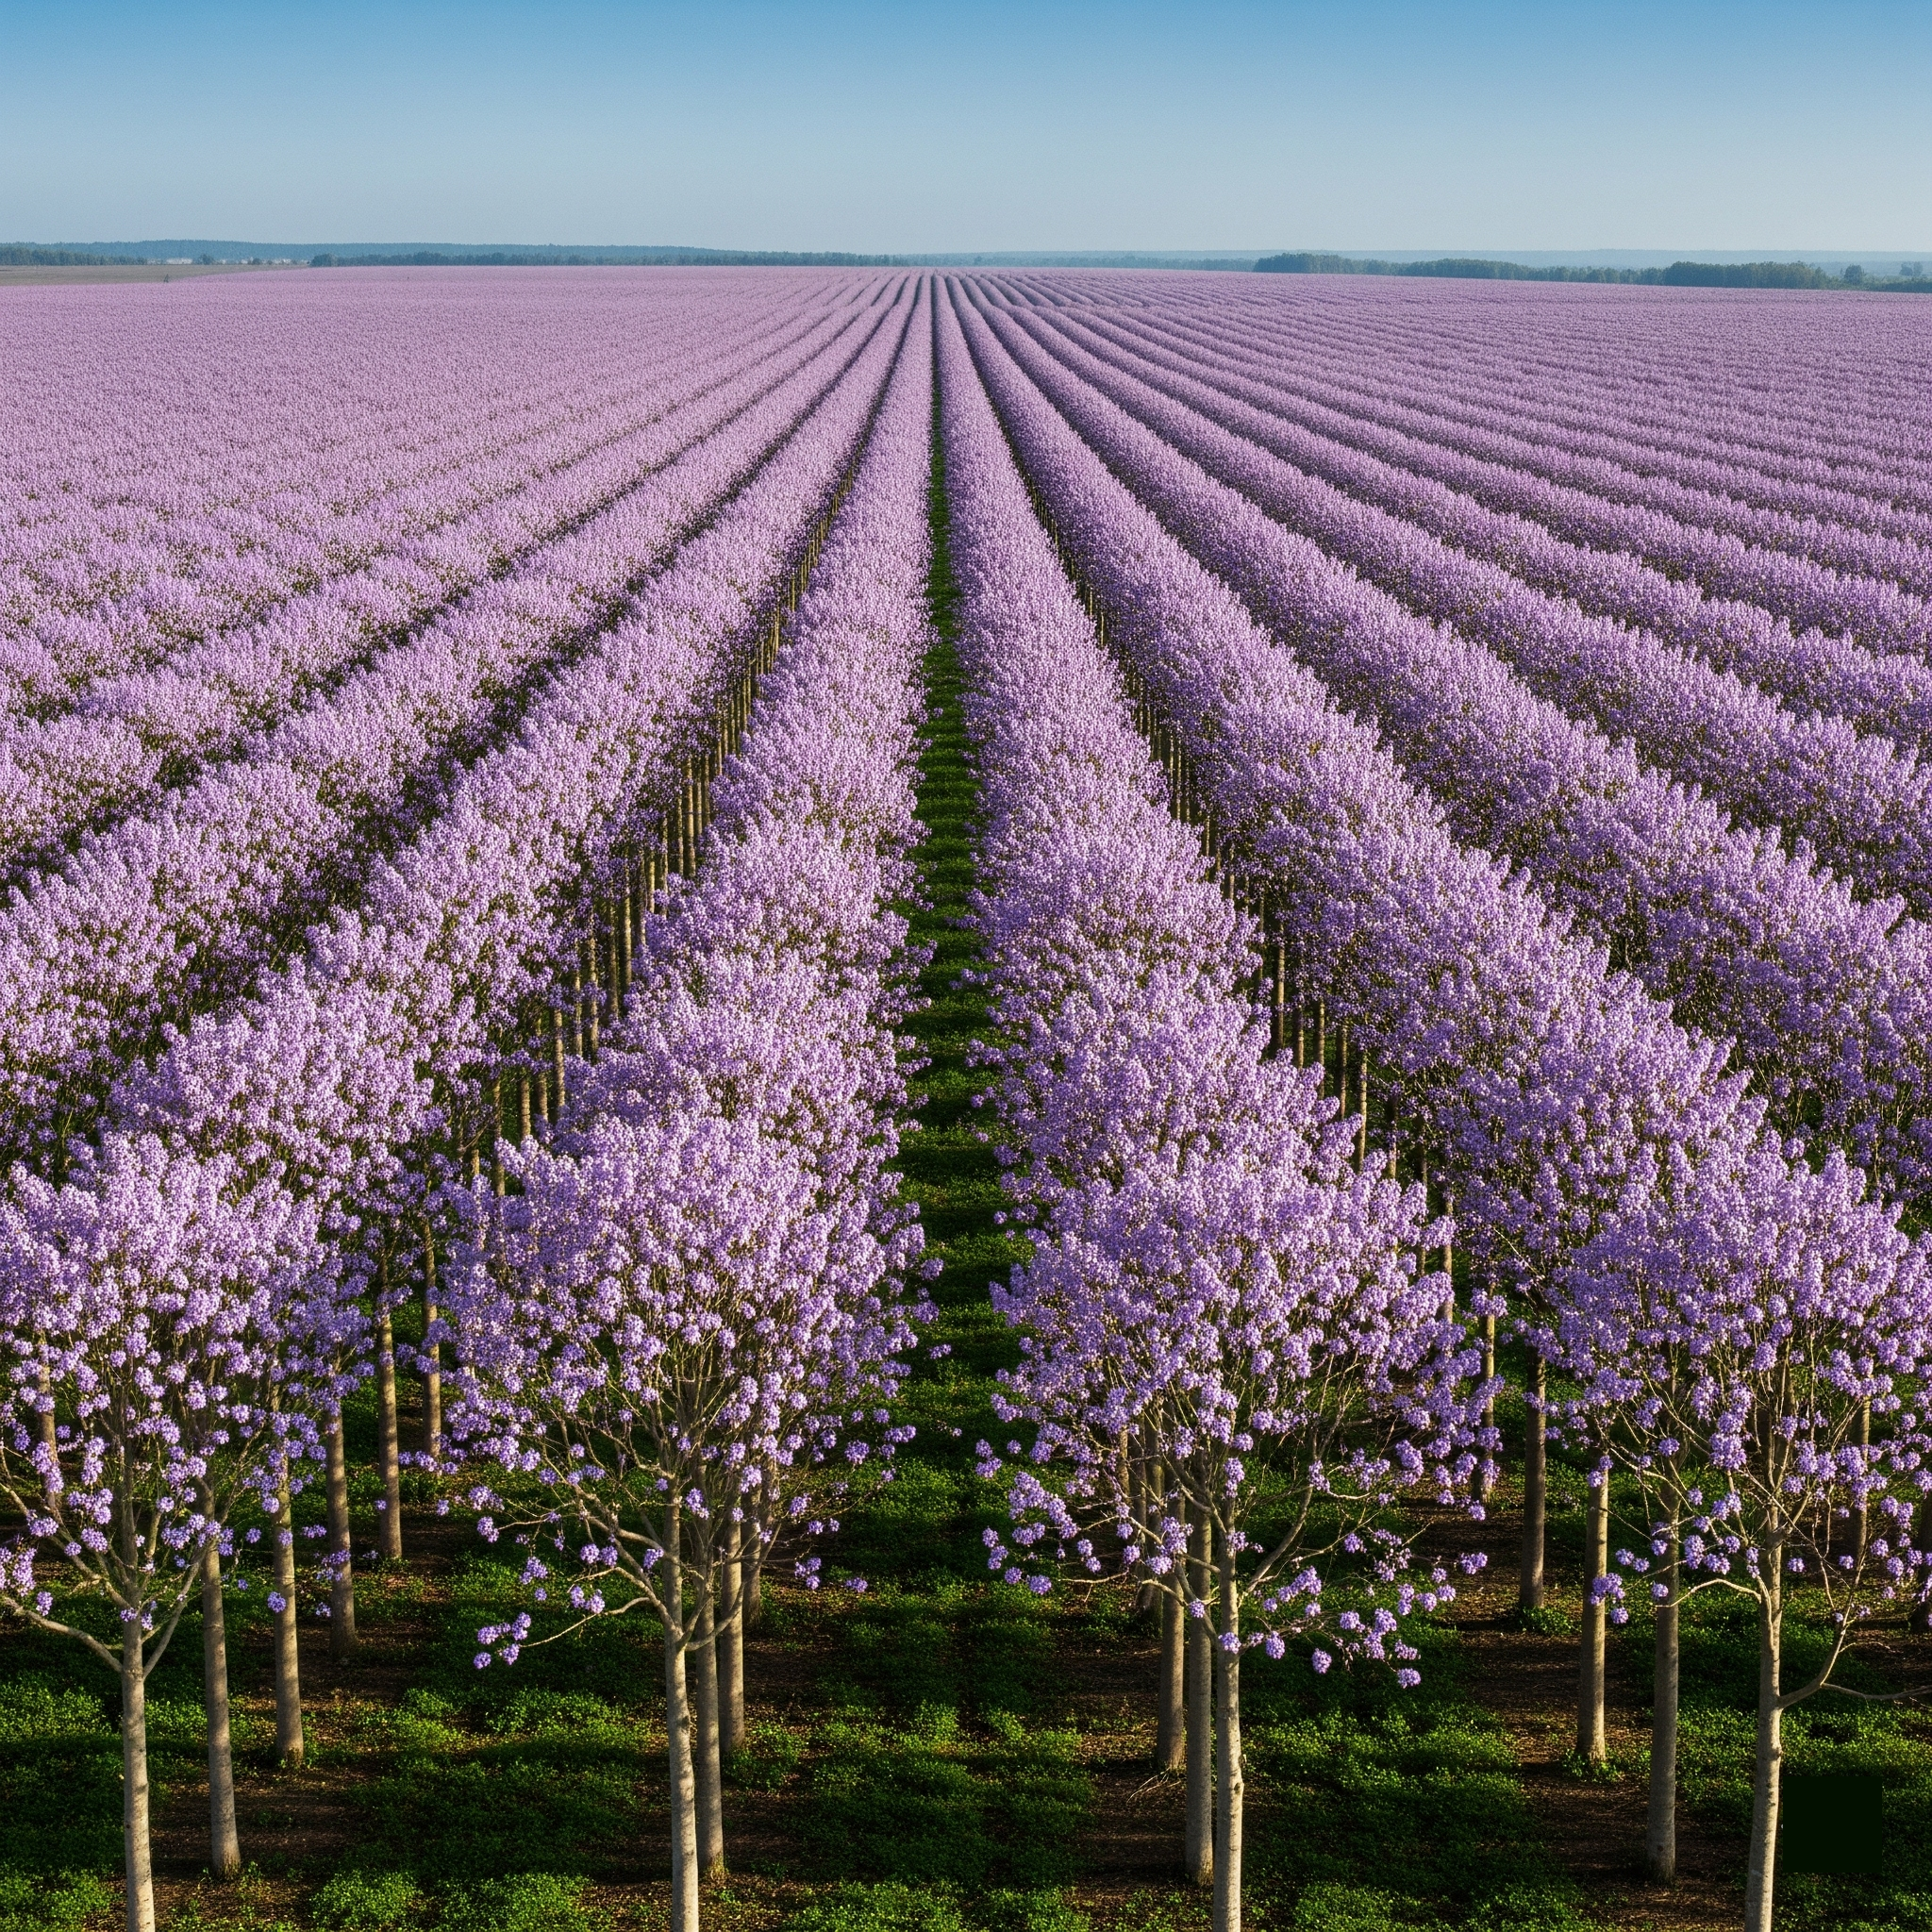
Japan has historically imported up to 70% of its paulownia supply. The tree — known in Japan as kiri — is not a commodity wood. It is a cultural and industrial cornerstone. It is used in:
Tansu cabinetry — the centuries-old Japanese chest tradition, where paulownia’s natural moisture-regulating properties protect silk kimonos and heirlooms
Koto musical instruments — Japan’s national stringed instrument, where the resonance and tonal properties of paulownia are irreplaceable
High-tech lightweight laminates — aerospace-adjacent industrial applications where paulownia’s unmatched weight-to-strength ratio and near-zero shrinkage make it the only viable natural material
Precision industrial crating and packaging — where its dimensional stability protects sensitive electronics and precision components during export
This is not a market that substitutes easily. You cannot swap paulownia for pine and call it done. The physical specifications — bone-dry consistency, tight grain, uniform density, low shrinkage — are non-negotiable for Japanese buyers.
And right now, those specifications are becoming impossible to source at scale.
The cost of inaction for Japanese buyers is not inconvenience. It is production shutdown.
PART B: STORY — What Is Actually Breaking the Supply Chain?
Three forces have converged simultaneously to create this crisis. Understanding all three is critical — because together, they are not a temporary disruption. They are a permanent structural realignment of where paulownia will be grown and traded for the next two decades.
Force #1: The Global Supply Chain Shock
A significant portion of Japan’s imported paulownia has historically originated from or processed through manufacturing hubs in East Asia. That pipeline is fracturing.
Escalated conflicts in the Middle East have caused a massive squeeze on crude oil and petrochemical derivatives — specifically naphtha, the feedstock for styrofoam, plastic foams, and synthetic protective packaging materials. Japanese domestic industries are facing critical shortages of the petroleum-derived packaging and insulation materials they have relied on for decades.
When synthetic packaging spikes in price or faces order suspensions, Japanese industries do not wait. They pivot. They lean back into what they know works — natural wood alternatives for high-end crating, precision packaging, and stable structural components.
Paulownia is at the top of that list.
The demand surge is not coming from one sector. It is coming from electronics manufacturers, precision instrument makers, traditional craft industries, and construction component suppliers — all simultaneously competing for a shrinking pool of available kiri stock.
The ripple effect is real. The demand is not speculative. It is already here.
Force #2: Decades of Domestic Depletion
Japan’s domestic paulownia supply has been in a multi-decade decline. This is not a new problem — but it has now reached a critical threshold.
An aging forestry workforce, land-use shifts toward urban development and rice cultivation, and the collapse of traditional rural forestry management have gutted Japan’s ability to self-supply. What was once a thriving domestic kiri industry has been reduced to a fraction of its former capacity.
For years, Japan compensated by importing from Southeast Asia and regional East Asian suppliers. That pipeline is now tightening too — rising production costs, inconsistent quality control, and geopolitical friction are making those traditional sources unreliable.
Japanese buyers are not looking for a short-term fix. They are looking for a long-term supply chain partner — one with the land, the infrastructure, the climate, and the operational discipline to deliver consistent, scalable, specification-grade paulownia year after year.
The United States — specifically the American South — is one of the very few places on Earth that can credibly offer all of that.
BioEconomy Solutions’ hybrid paulownia program in South Carolina produces non-invasive, non-GMO, seed-sterile clones specifically engineered for tight grain, uniform density, and the kind of dimensional stability that Japanese buyers require. These are not wild-harvested trees. These are purpose-grown, specification-matched feedstocks — the American equivalent of Japan’s Reference Wood standard.
That is exactly what a supply-starved Japanese market needs to de-risk their supply chain.
Force #3: Currency Volatility Forcing Safe-Haven Purchasing
The third force is financial — and it is accelerating everything.
The Japanese Yen has faced immense pressure in recent months, briefly dipping to 160 JPY to the USD before massive multi-billion-dollar interventions by Japan’s Ministry of Finance stabilized it back to the 155 range. That kind of volatility — a 10%+ swing in the world’s third-largest economy’s currency — does not just affect tourists and exporters. It fundamentally changes how industrial procurement teams think about risk.
When your currency is this volatile, spot-market purchasing from fragmented regional brokers becomes a liability. Every purchase is a currency bet. Every shipment is a hedge that might not pay off.
The response from sophisticated Japanese industrial buyers is predictable and rational: lock down direct, secure supply chain partnerships with established North American feedstock operators. Hedge against future currency and supply shocks by securing volume commitments, predictable pricing structures, and direct relationships with producers who can guarantee consistency.
This is not a trend. This is a structural shift in how Japanese timber procurement works.
And BioEconomy Solutions is already receiving the calls.
PART C: SHIFT — The Lesson That Changes Everything
Here is what this moment teaches us — and it goes far beyond paulownia.
The global bioeconomy is not a future concept. It is a present reality being shaped right now by supply chain fractures, geopolitical disruptions, currency volatility, and the irreversible depletion of traditional natural resource pipelines.
The companies and landowners who position themselves correctly in the next 24 months will not just participate in this market. They will define it.
For too long, the narrative around paulownia in North America has been focused almost entirely on carbon credits and domestic timber markets. Both are real and valuable. But the Japanese inquiry changes the frame entirely.
This is not just a carbon story. This is a global supply chain story.
American-grown paulownia — produced at scale, to specification, with the consistency and traceability that international industrial buyers demand — is a strategic asset in a world where natural material supply chains are fracturing everywhere at once.
The lesson is this: When the world’s most quality-obsessed timber market starts calling your farm directly, you are not just a tree grower. You are a supply chain solution.
The question is whether you are ready to operate at that level.
BioEconomy Solutions is building the infrastructure — the plantation capacity, the drying and grading systems, the blockchain-verified traceability, and the direct buyer relationships — to be exactly that solution. Not just for Japan. For every market where the old supply chains are breaking and new ones need to be built.
The tree grows fast. The window to position is not.
BRICK 3 — BOOST THE SHARE (Shareability + CTA)
The bottom line:
Japan’s kiri crisis is not a niche story for timber traders.
It is a signal — one of the clearest signals we have seen — that the global demand for specification-grade, sustainably produced, traceable natural materials is accelerating faster than supply can respond.
Three forces are driving this simultaneously:
A petrochemical supply shock pushing industrial buyers back to natural wood alternatives
Multi-decade domestic depletion leaving Japan structurally dependent on foreign supply
Currency volatility forcing long-term direct partnerships over fragmented spot-market purchasing
American paulownia — grown right, graded right, and delivered with the consistency international buyers require — is positioned to fill a gap that no other supplier in the world is currently equipped to fill at scale.
BioEconomy Solutions is already in those conversations.
If you are a landowner, carbon developer, ESG investor, or industrial buyer who wants to understand what this supply shift means for your operation or portfolio — let’s talk.
The calls from Japan are already coming in.
The question is: will you be part of the supply chain that answers them?
What’s the biggest barrier you see to scaling American paulownia for international industrial markets? Drop it in the comments — I read every one.
Interested in exploring paulownia supply chain partnerships, carbon credit development, or plantation investment?
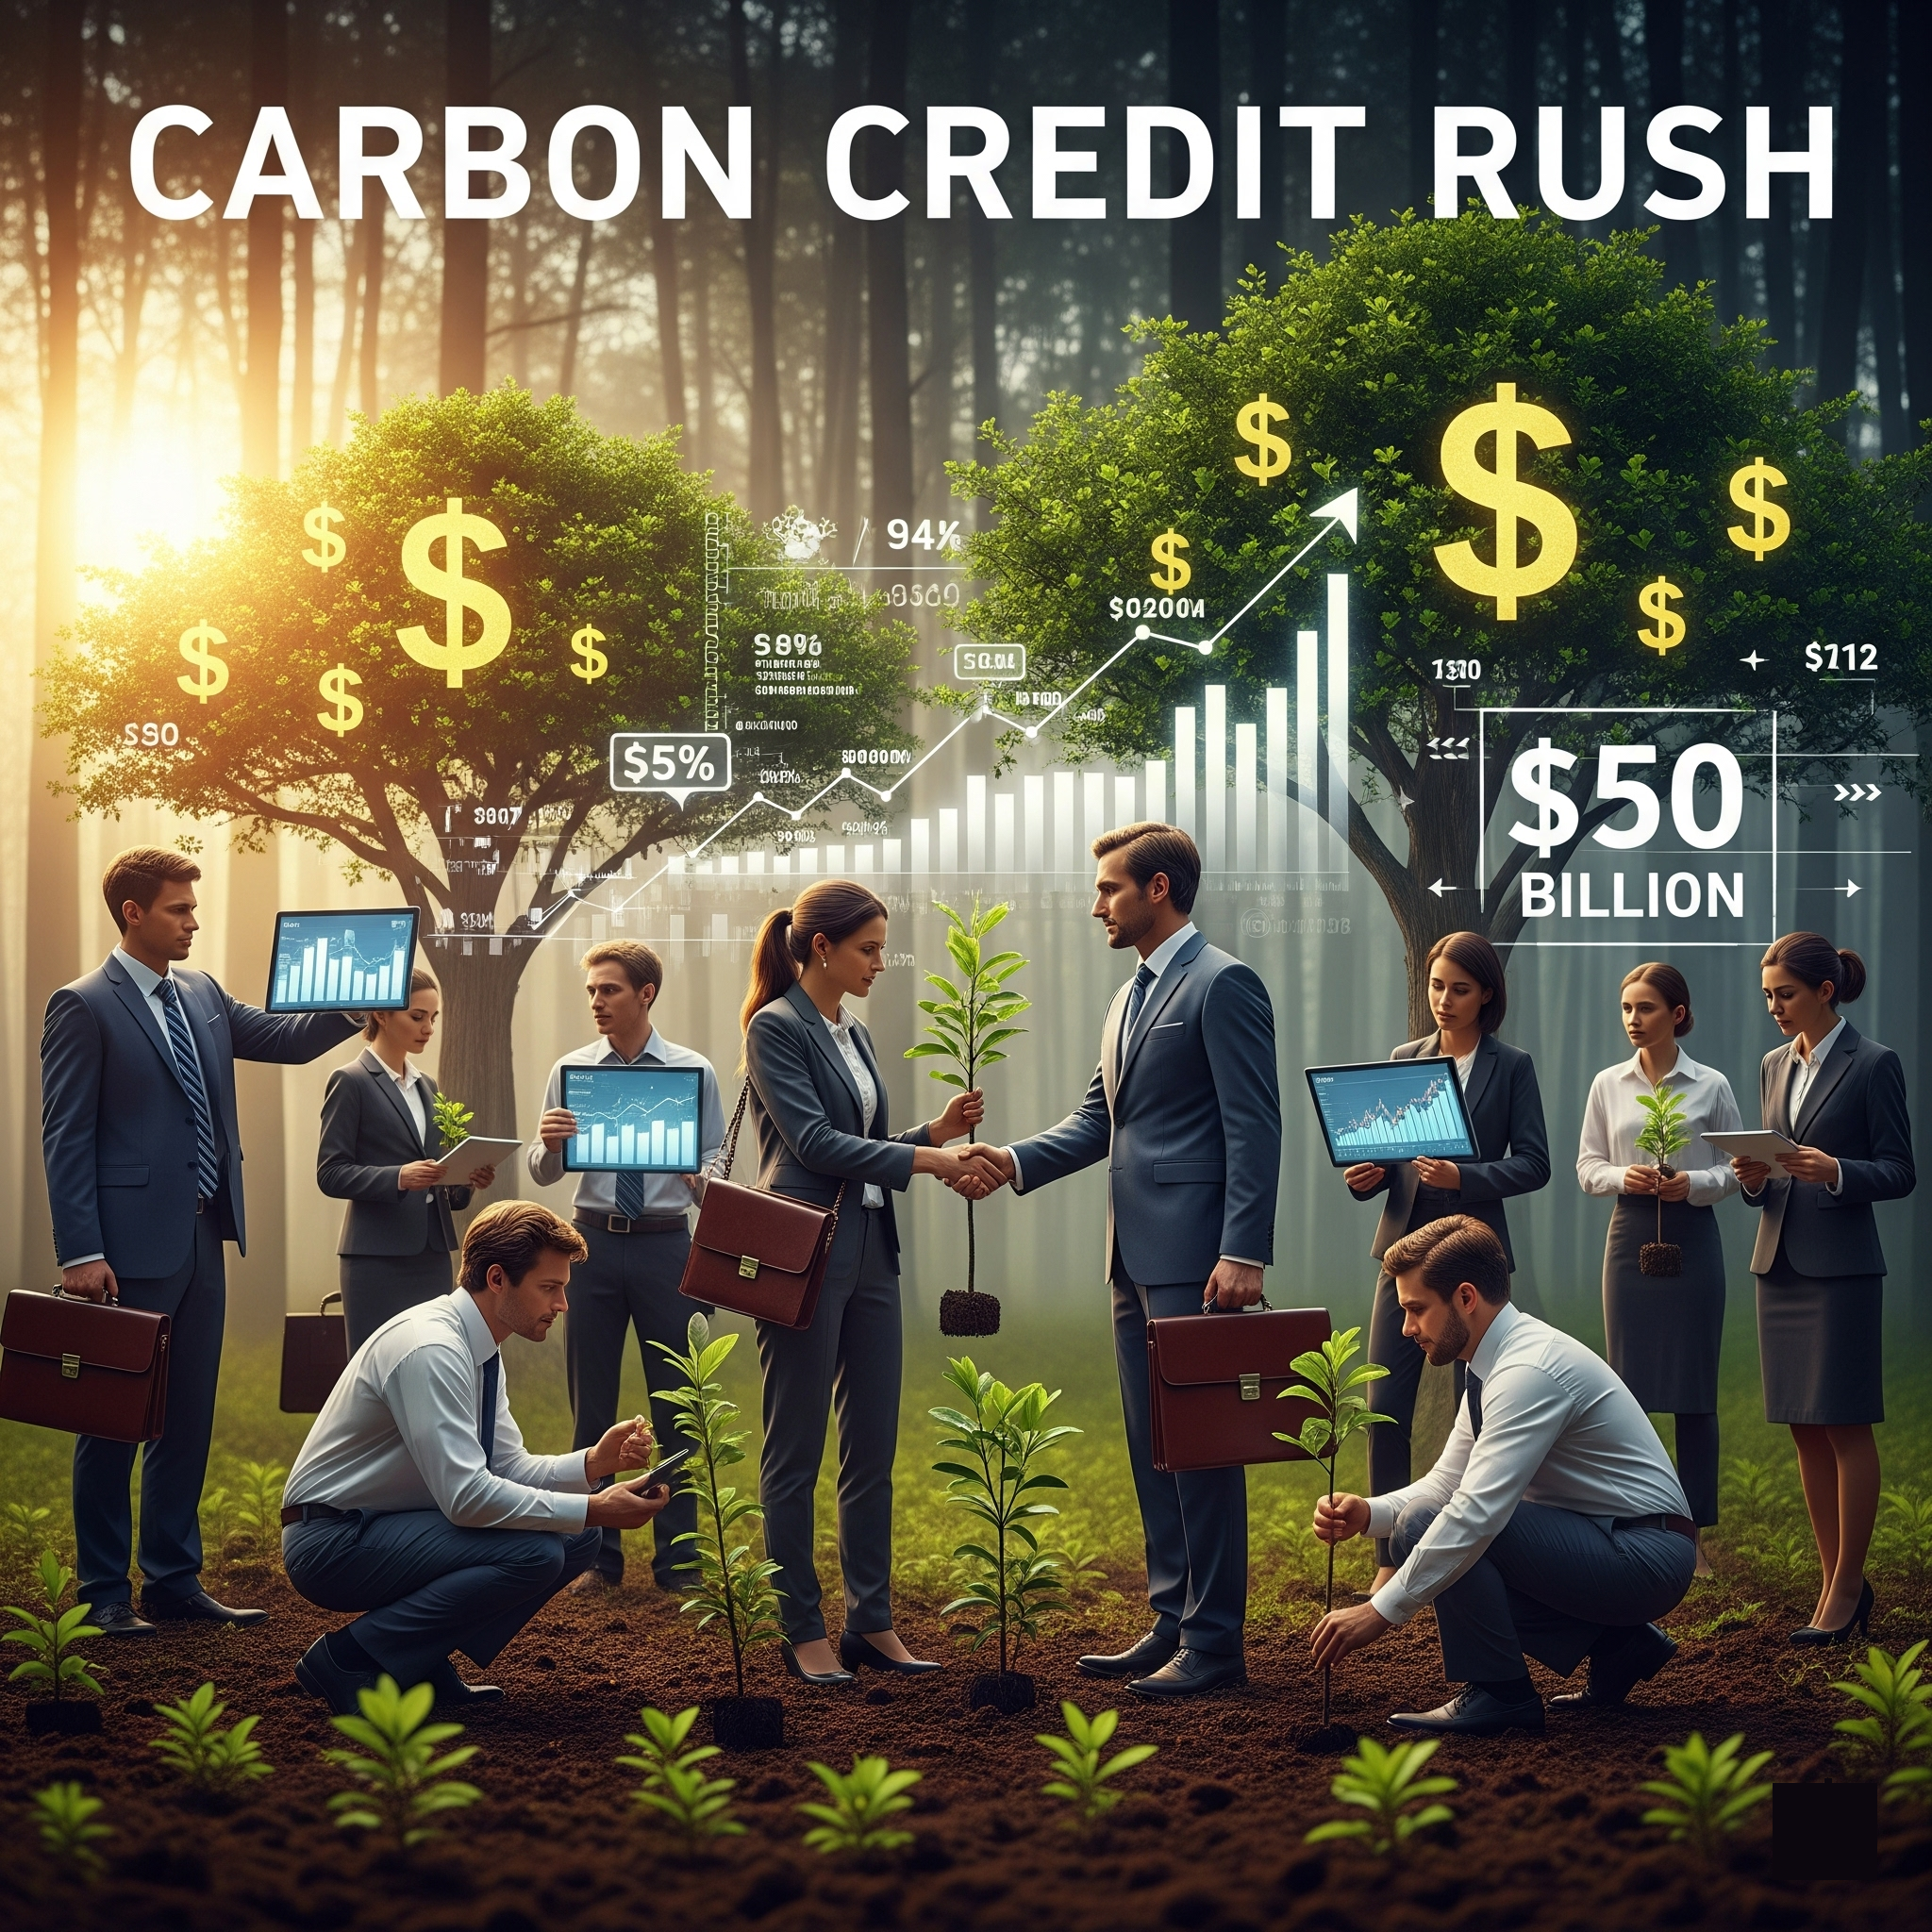
The biggest wealth transfer in modern industrial history is happening right now. Here’s what the data says — and what it means for where capital should be moving.
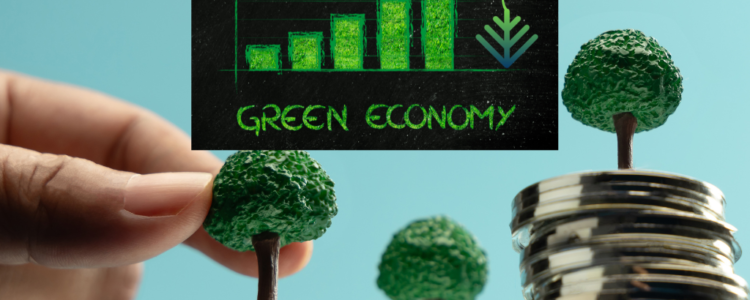
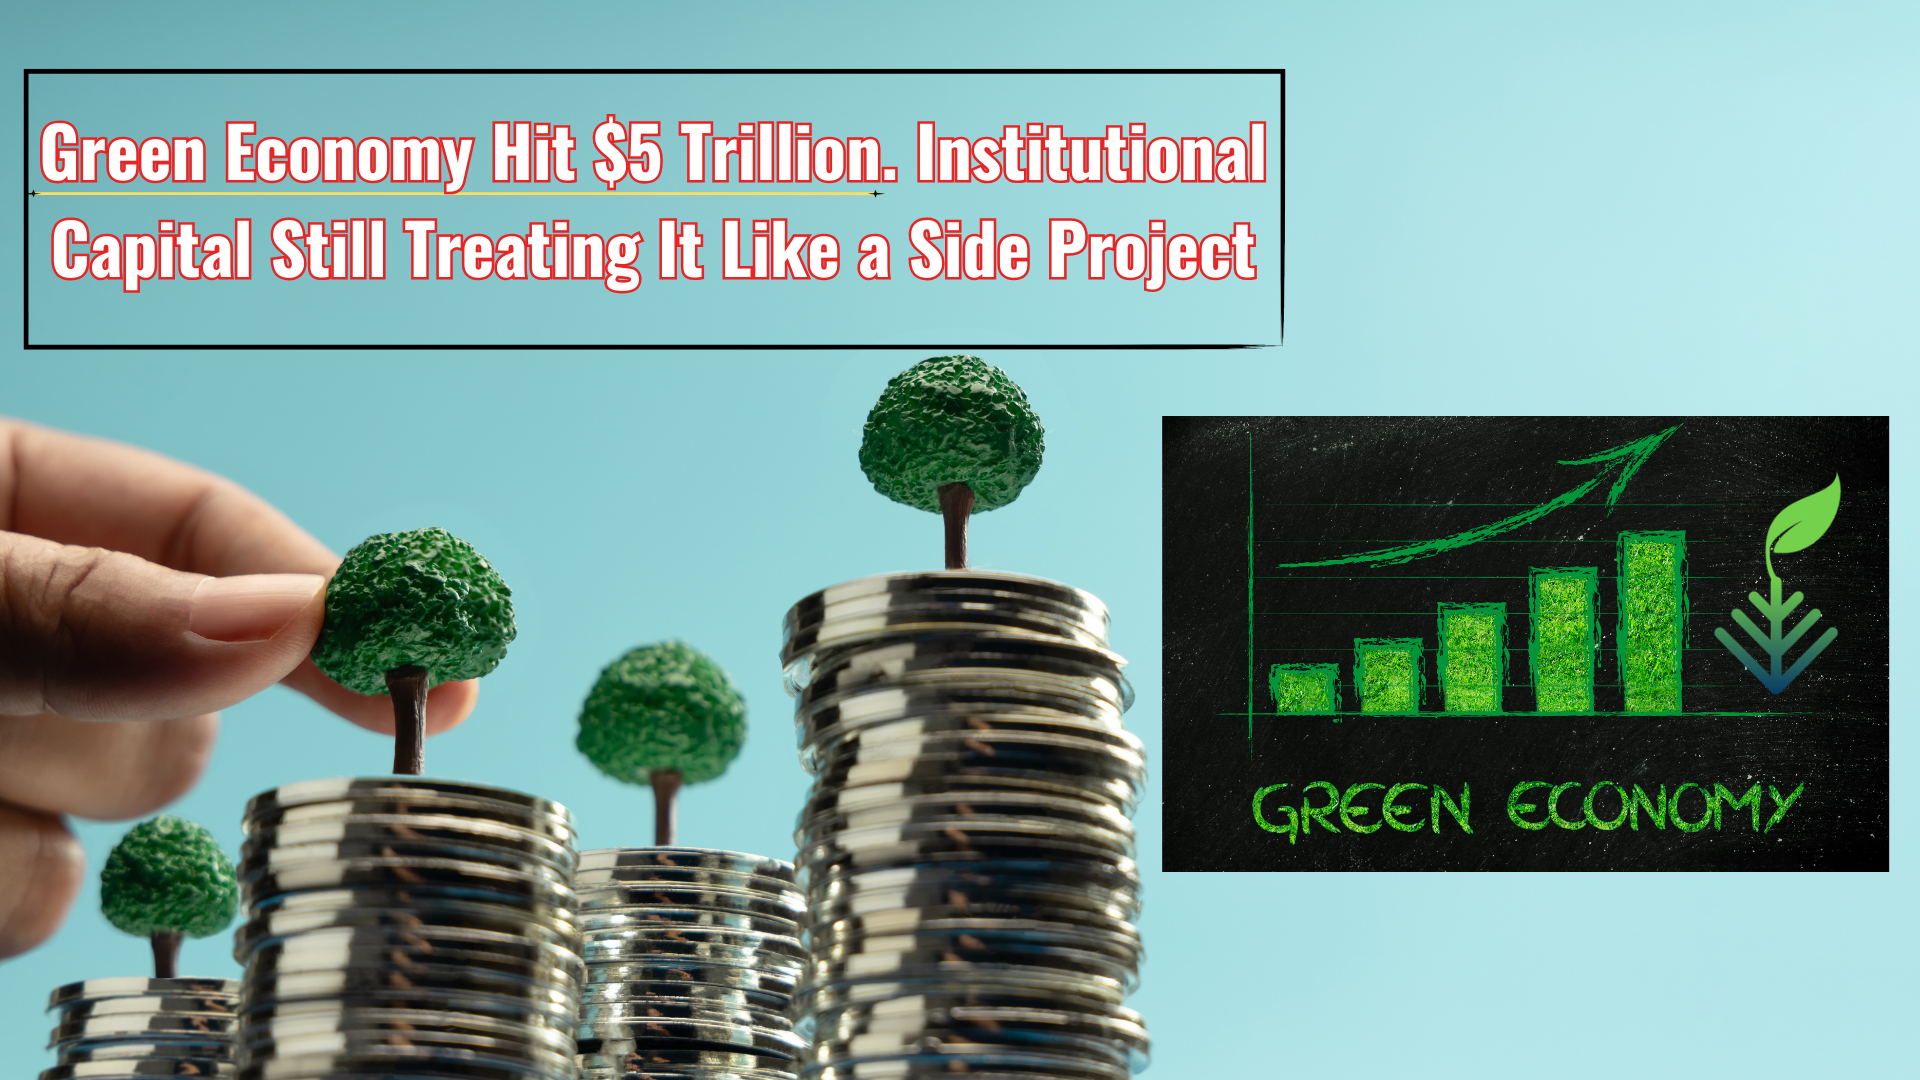
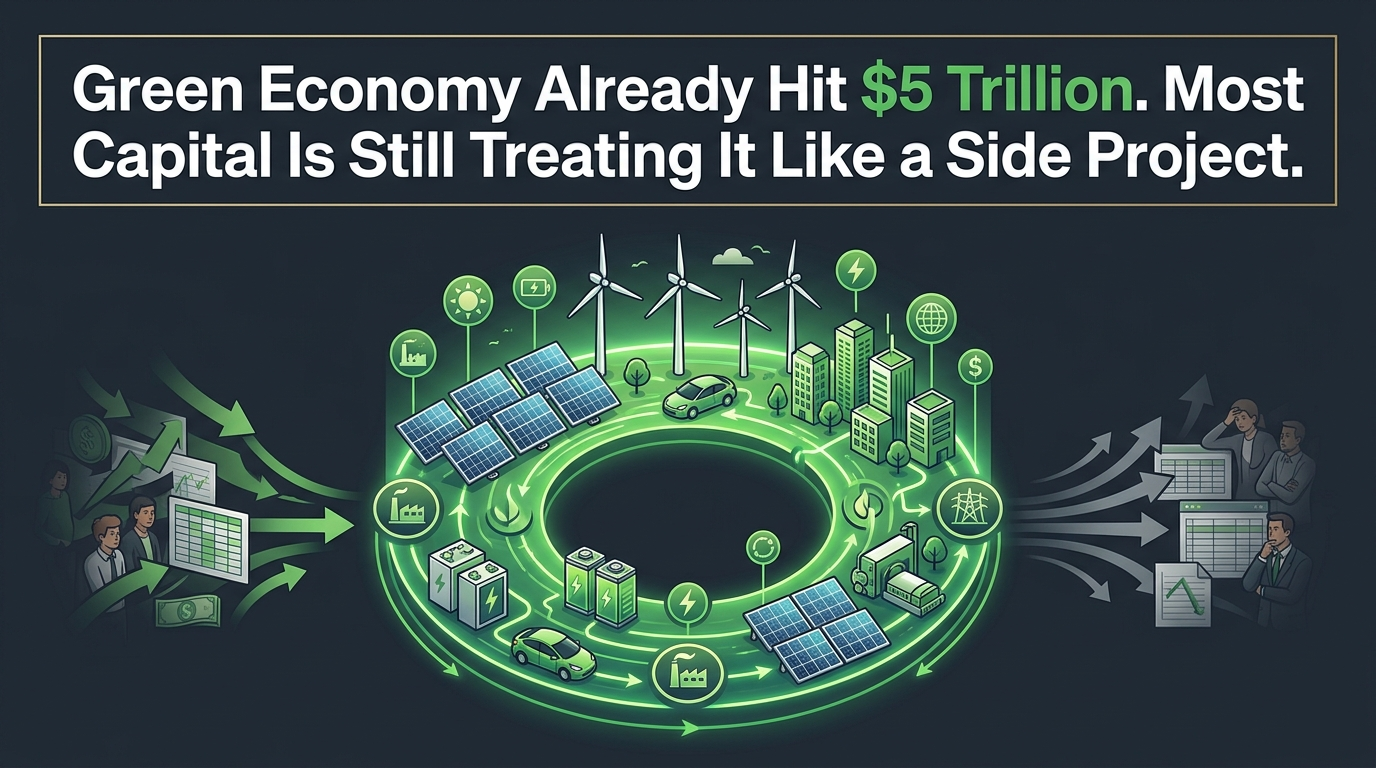
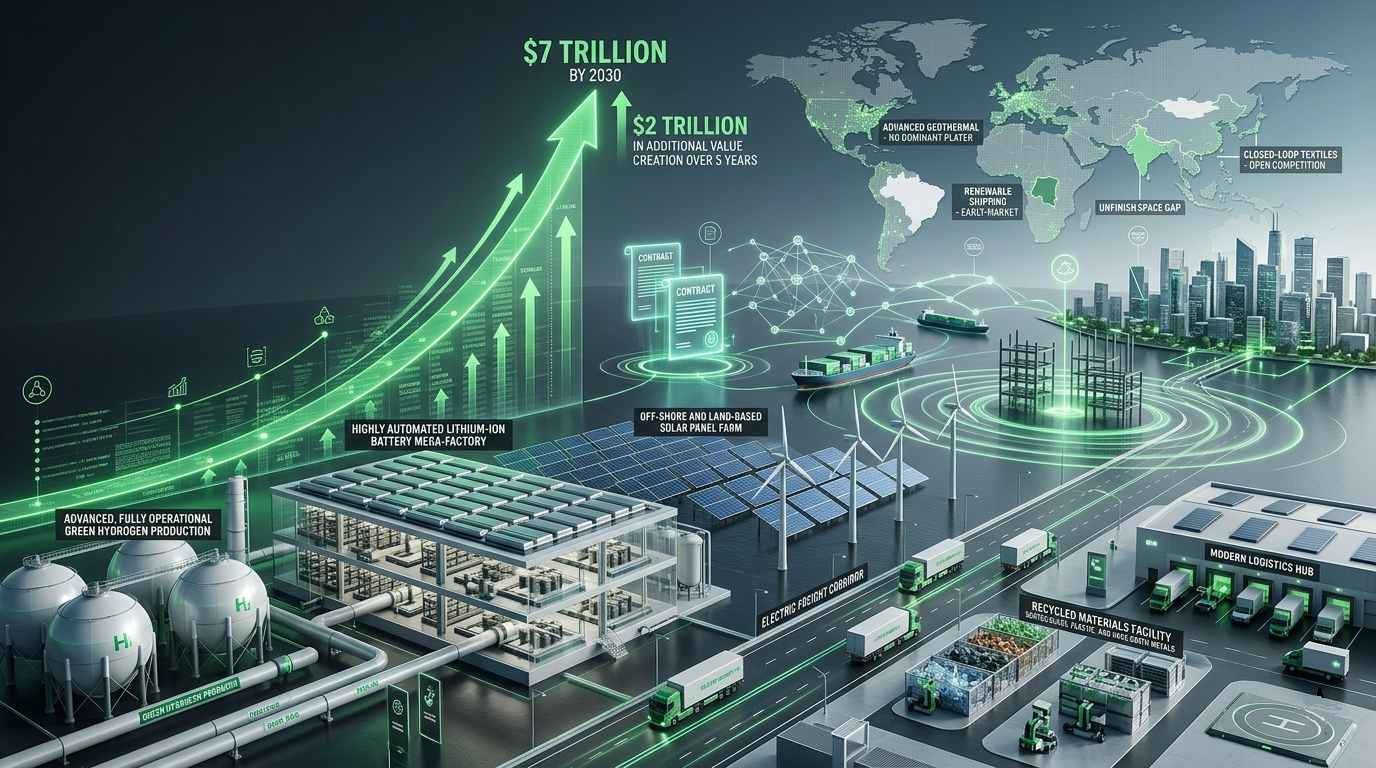
So the data confirms it! The World Economic Forum (WEF), in collaboration with BCG, confirmed in late 2025 that the global green economy surpassed $5 trillion in annual value, with projections to exceed $7 trillion by 2030.
So The Green Economy Hit $5 Trillion. Most People Are Still Treating It Like a Side Project, why is that?
Let’s start with a number that should stop you mid-scroll.
$5 trillion. 💲💲💲💲💲⬅️
That is the current annual value of the global green economy as of 2025. Not projected. Not aspirational. Not a climate activist’s wish list. Current. Verified. And growing at twice the rate of conventional business revenues.
The World Economic Forum (WEF), in collaboration with BCG, confirmed in late 2025 that the global green economy surpassed $5 trillion in annual value, with projections to exceed $7 trillion by 2030.
Growing twice as fast as traditional industries, this sector is now the second-fastest growing area after:
Technology
Green Economy
The green economy is now the second-fastest growing market on the planet — behind only the technology sector. It is outpacing traditional industry driven by energy and transport. It is attracting premium capital. And it is reshaping global trade in ways that most operators, investors, and business leaders are still not fully pricing into their decisions.
This is not an environmental story. This is an economic story. And if you’re not reading it as one, you’re already behind.
What $5 Trillion Actually Means
Numbers at this scale are easy to dismiss. They feel abstract. So let’s make it concrete.
The global green economy generating $5 trillion annually means it is larger than the entire GDP of Japan — the third-largest economy in the world. It means it is larger than the combined GDP of every country in Africa. It means that the companies, operators, and capital allocators who have positioned themselves inside this market are not operating in a niche. They are operating in a core industrial sector creating infrastructure to support its growth.
And here is the part that matters most for anyone thinking about where to deploy capital or build a business over the next five years:
Green revenues are currently expanding at twice the rate of conventional business revenues.
That is not a marginal advantage. That is a structural one. When a sector grows at double the rate of the broader economy, compounded over five years, the gap between those who are positioned inside it and those who are not becomes very difficult to close.
The projection to $7 trillion by 2030 represents $2 trillion in additional value creation over five years. That is $2 trillion in new contracts, new supply chains, new infrastructure, new materials markets, and new business models — most of which do not yet have dominant players.
The window is open. But windows close.
Why This Is Happening Now — The Three Pillars Driving the Surge
Understanding why the green economy has reached this scale is not just academic. It tells you where the durable value is — and where the speculative froth is.
Global industry leaders have identified three operational pillars driving the surge to $5 trillion. Each one has direct implications for where capital should be positioned.
Pillar 1: Technology Maturity
The first wave of the green economy was built on promises. Solar would get cheap. Wind would scale. Electric vehicles would become mainstream. Battery storage would solve the intermittency problem.
Those promises have been kept. The technologies matured. The levelized costs came down. And what was once a subsidized experiment is now a cost-competitive industrial reality.
But here is what most people miss about technology maturity cycles: the biggest returns don’t come from the technology itself. They come from the:
Infrastructure
Materials
Supply chains
that the technology requires at scale.
When solar manufacturing scaled, the demand for industrial-grade silicon, aluminum framing, and specialized coatings scales with it. When electric vehicle production scales, the demand for battery-grade lithium, cobalt, and manganese scales with it. When green construction scales, the demand for certified sustainable building materials scales with it.
The technology is the headline. The supply chain is where the money is made.
The implication: The most durable positions in the green economy right now are not in the technologies themselves — they are in the certified, industrial-grade inputs those technologies require to operate at scale.
Pillar 2: Regulatory Navigation
The second pillar is the one that separates operators who understand this market from those who are still treating it as optional.
The regulatory environment around green economy participation is not softening. It is accelerating.
The Inflation Reduction Act in the United States has deployed hundreds of billions of dollars in subsidies, tax credits, and incentives tied to domestic green manufacturing and clean energy deployment. The Green Deal Industrial Plan in Europe is doing the same across the EU. International climate disclosure frameworks — including mandatory Scope 3 emissions reporting — are moving from voluntary to required in jurisdiction after jurisdiction.
What this means in practice: companies that cannot document the sustainability credentials of their supply chains are going to face increasing friction in accessing capital, winning contracts, and operating in regulated markets. Companies that can document those credentials — with certified, verifiable data — are going to command a premium.
This is not a compliance cost. It is a competitive advantage. And the organizations that understand the difference are the ones building positions right now.
The implication: Regulatory alignment is not a legal department problem. It is a strategy problem. The companies that build regulatory navigation into their core operating model — rather than treating it as a cost center — are going to have structurally lower costs of capital and structurally higher valuations than their peers.
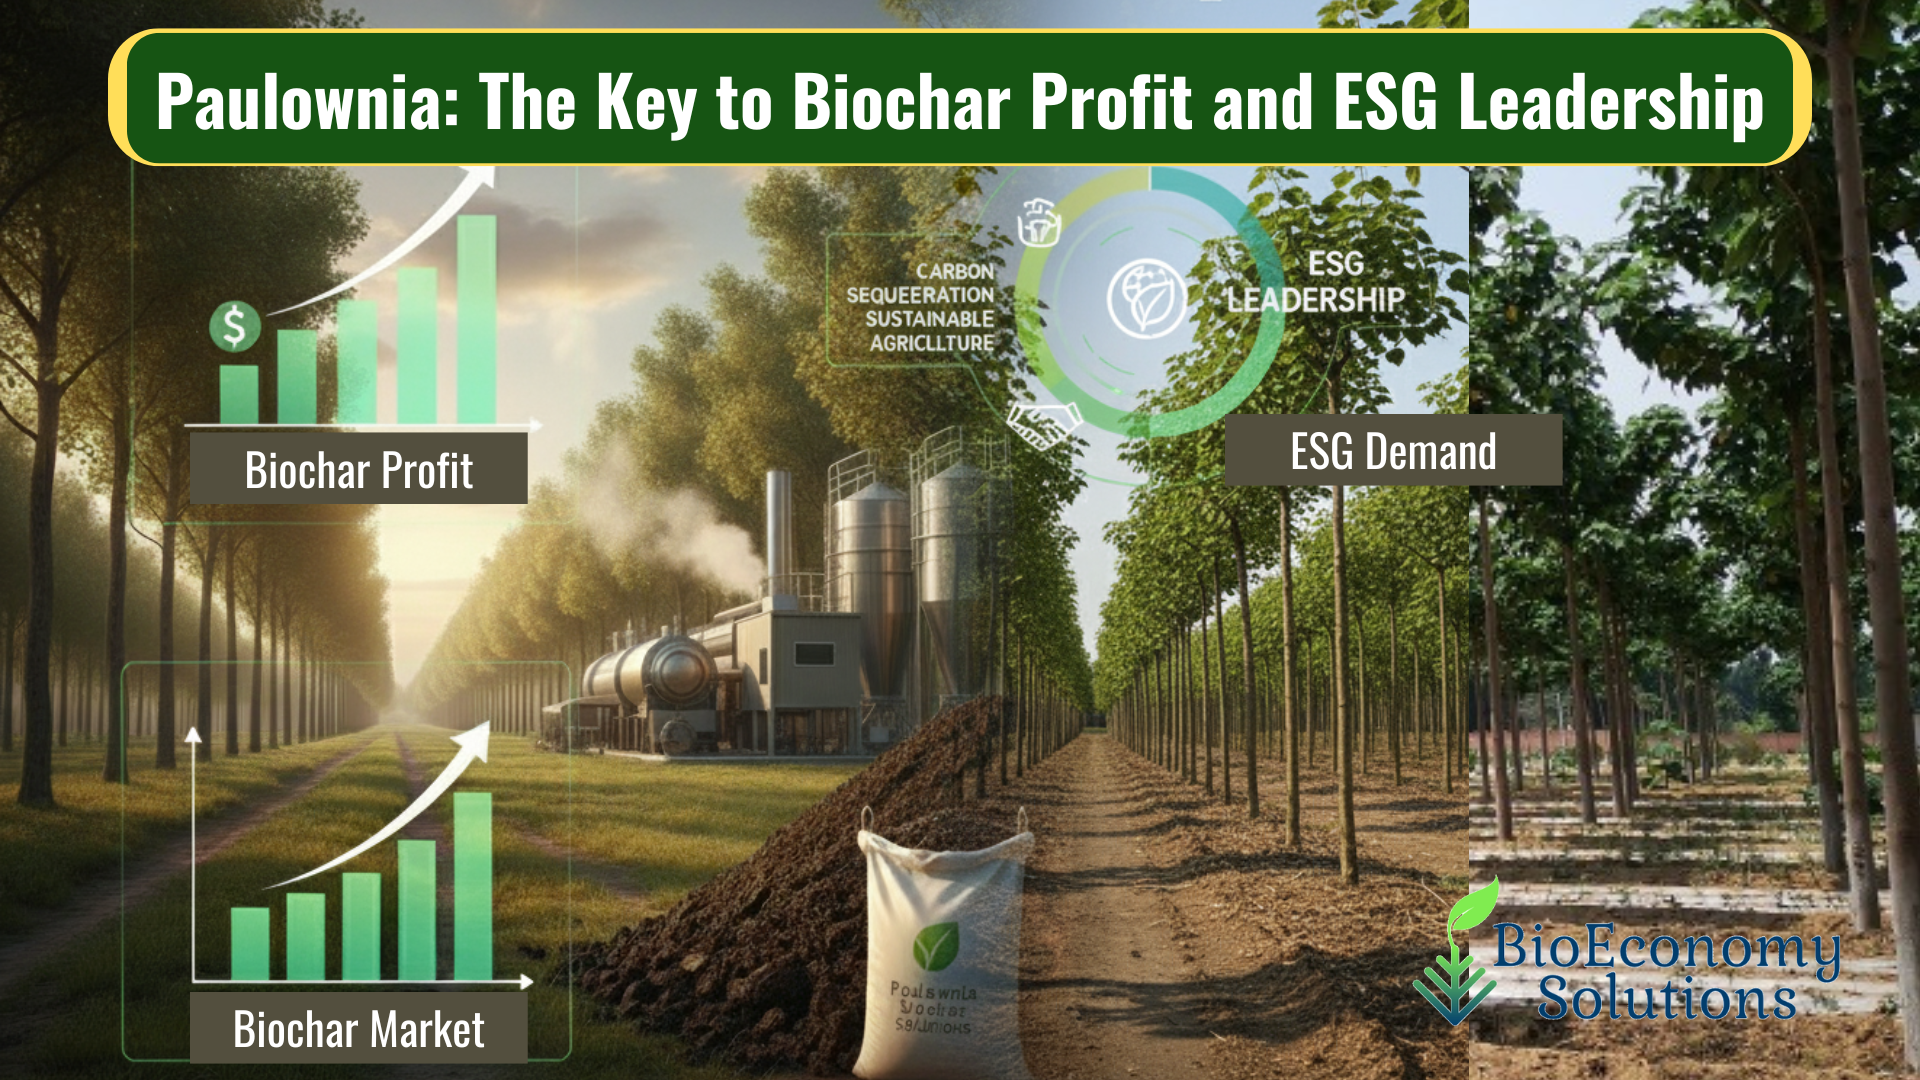
Pillar 3: Industrial Feedstocks
This is the pillar that is least understood — and where some of the most significant near-term opportunity exists.
As the green economy has scaled from theoretical models to practical industrial applications, the demand for certified, industrial-grade sustainable inputs has become a critical bottleneck.
The technologies exist. The regulatory frameworks exist. The capital exists. What is increasingly scarce is the high-quality, verifiable, sustainable raw material that large-scale green manufacturing requires. This is where BioEconomy Solutions exist.
The report is specific about this: high-yield biomass and bio-based materials are transitioning from specialized applications into essential industrial feedstock supply chains. High-density cultivation models producing over 100 to 150 bone dry tons per acre within two to three years are no longer forestry projects. They are industrial supply chain assets.
The language in the report is precise and worth noting: these inputs are becoming essential for meeting the “gold standard” requirements of large-scale green manufacturing.
That language tells you everything about where the pricing power is going to sit in this market over the next five years.
The implication: The scarcest and most valuable resource in the green economy over the next five years is not capital. It is not technology. It is certified, high-quality, industrial-grade sustainable feedstock. The operators who control that supply — with verified credentials, documented yield data, and established supply chain relationships — are going to be in an extraordinarily strong negotiating position.
The Shift That Changes Everything: From Commitments to Execution
Here is the single most important strategic insight in the entire report — and it is stated plainly enough that it is easy to read past it without fully absorbing it.
The market is shifting its focus from “climate commitments” to “operational execution.”
Read that again.
For the past decade, the green economy has been largely driven by commitments. Net zero pledges. Carbon neutrality targets. ESG frameworks. Sustainability reports. The language of intention.
Growth follows public and private momentum in climate action and adaptation over the last decade The sector’s expansion reflects a sustained momentum in climate action in both national and private spheres.
Today, 142 countries, covering more than 76% of global emissions, have a net-zero commitment in place – up from virtually zero in 2016. Many have implemented regulatory frameworks with increasingly strict emissions standards or have pushed the expansion of low-carbon technologies. Over the same period, corporate decarbonization target-setting has grown exponentially.
By mid-2025, the number of companies with science-based emission reduction targets, or a commitment to set such a target, had surged to 10,949 from just 116 in 2015.9 These companies now represent more than 40% of global market capitalization and approximately 25% of global revenue.
The $2 trillion in additional value projected between now and 2030 is not going to be captured by organizations that make better commitments. It is going to be captured by organizations that execute. That build. That deliver verifiable, measurable, documented results.
This shift has profound implications for every participant in the market — from large corporations to small operators to capital allocators.
For corporations: The ESG report is no longer sufficient. Investors, regulators, and counterparties are demanding operational proof. Supply chain documentation. Verified emissions data. Certified material sourcing. The organizations that can provide that documentation are going to access capital at lower cost and win contracts that their competitors cannot.
For operators and suppliers: The premium is moving to certification and verification. A sustainable material without documentation is worth market price. The same material with certified, verifiable credentials — traceable origin, documented yield, third-party verified sustainability metrics — commands a significant market premium. The report is explicit: certified industrial-grade sustainable materials will command a significant market premium as Scope 3 reporting becomes mandatory.
For capital allocators: The deals worth doing in this market are not the ones with the best climate story. They are the ones with the best operational infrastructure. Verified feedstock supply. Documented performance data. Regulatory alignment. Scalable execution capacity. The capital that flows to those deals is going to generate returns that the commitment-era investments cannot match.
BioEconomy Solutions has produced a standalone platform that offers The ESG Market! (3 T’s)Traceability, Transparency and Trust. Using real-time telemetry and real-time-data.
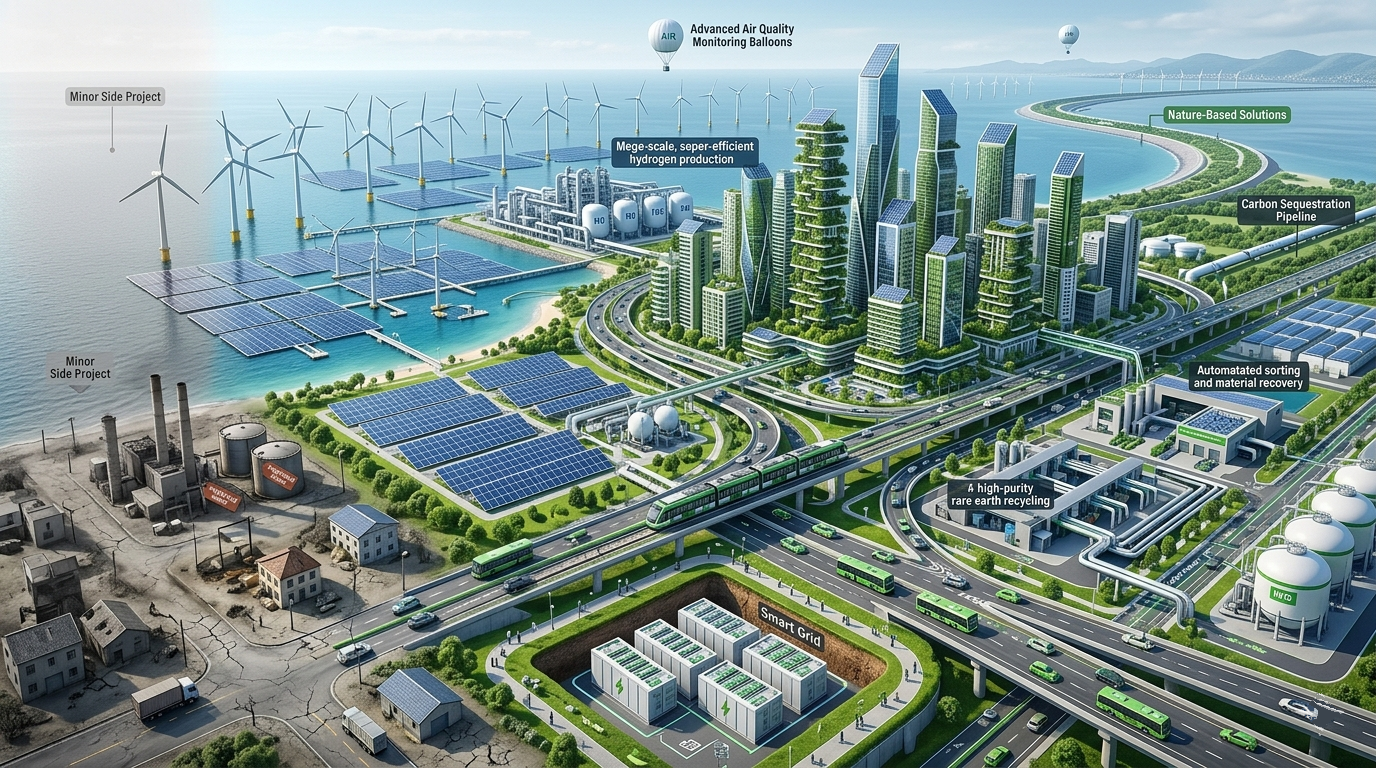
Where the $2 Trillion Is Going — Sector by Sector
The report identifies specific areas where the expansion from $5 trillion to $7 trillion is expected to concentrate. Understanding the distribution matters for positioning.
Energy and Transport
These remain the largest segments of the green economy and will continue to attract the largest absolute capital flows. But the growth story in energy and transport is increasingly about infrastructure and supply chain rather than technology. The technologies are proven. The bottleneck is execution — grid infrastructure, charging networks, manufacturing capacity, and the certified materials those systems require.
Green Construction
This is an emerging growth area that is significantly underappreciated in most market analyses. As building codes tighten, as embodied carbon becomes a regulated metric, and as green building certifications move from premium to standard, the demand for certified sustainable construction materials is going to accelerate sharply. This is a market that is large, fragmented, and in the early stages of consolidation around quality and certification standards.
Circular Waste Management
The transition from linear to circular material flows is creating new business models across virtually every industrial sector. The value in this space is in the infrastructure — collection systems, processing capacity, certified recycled material supply chains — not in the concept.
Regenerative Agriculture
This is the sector with perhaps the longest runway and the most significant near-term supply-demand imbalance. As Scope 3 emissions reporting becomes mandatory, the demand for verified carbon sequestration, certified sustainable agricultural inputs, and documented regenerative practices is going to exceed supply for the foreseeable future. The operators who are building verified, scalable regenerative agriculture systems right now are building assets that are going to be extraordinarily valuable in a mandatory reporting environment.
Biomass and Carbon Sequestration
The report is specific and worth quoting directly: “There is an increasing demand for verifiable, high-efficiency biological sources.”
Verifiable. High-efficiency. Biological.
Those three words define the quality standard that the market is moving toward. Not biomass. Verifiable biomass. Not carbon sequestration. High-efficiency carbon sequestration. The premium is in the verification and the efficiency — not just the existence of the resource.
High-density cultivation models producing 100 to 150 bone dry tons per acre within two to three years are explicitly identified as transitioning from specialized forestry into essential industrial feedstock supply chains. That transition is happening now. The supply chain infrastructure to support it is being built now. The operators who are positioned inside that transition — with verified yield data, certified sustainable practices, and established offtake relationships — are building positions that are going to be very difficult to replicate in three to five years.
BioEconomy Solutions provides traceability and feedstock security to all of these sectors.
The Capital Advantage Nobody Is Talking About Loudly Enough
The Lower Cost Capital Advantage
Capital Advantage: Companies operating within the green sector are increasingly benefiting from “smart capital,” enjoying lower costs of debt and premium valuations on capital markets compared to carbon-intensive peers.
Companies in the green economy typically obtain access to cheaper capital Companies with green revenues can benefit both when raising equity and borrowing capital. They often enjoy better financing terms, including lower weighted average cost of capital (WACC).
BCG analysis found a correlation consistent across all industries that companies with green revenues secure a lower cost of capital at an average of~43 basis points (bps) less than companies without green revenues (see Figure 15 for detailed WACC discounts on selected industries) on page 26 of the report.
Notably, new debt financing vehicles often offer lower-cost financing to companies funding green projects (e.g. green bonds). A lower risk profile of companies in green markets can also justify a lower cost of debt. Leading financial institutions highlight that companies with access to cheaper capital can often generate higher share prices.
This means that secondary share issues and mergers and acquisitions transactions are less dilutive. A better valuation may support lower interest rates, lowering overall capital costs. As a result, companies with access to cheaper capital can invest in green growth opportunities more easily and efficiently – creating a virtuous cycle that improves revenues, overall financial performance and market valuations.
This is not a soft benefit. This is a hard financial advantage that compounds over time.
Lower cost of debt means that green economy operators can finance growth at lower rates than their conventional competitors. Over a five-year capital deployment cycle, that difference in financing cost translates directly into competitive advantage — the ability to bid more aggressively, invest more heavily, and scale faster than competitors who are paying higher rates for the same capital.
Premium valuations mean that when green economy operators access equity markets — whether through private investment rounds, strategic partnerships, or public markets — they are receiving higher multiples for the same earnings than carbon-intensive peers. That premium valuation is not just a paper gain. It is a real cost-of-capital advantage that affects every subsequent financing decision.
The organizations that understand this dynamic are not just building green businesses because they believe in the mission. They are building green businesses because the financial structure of the green economy is fundamentally more advantageous than the financial structure of conventional industry — and that advantage is growing, not shrinking, as regulatory pressure increases and capital markets continue to price carbon risk into valuations.
Any honest analysis of a $5 trillion market opportunity has to include the failure modes. Here are the ones worth taking seriously.
Policy Reversal Risk: Green economy growth has been significantly accelerated by policy support — the IRA, the Green Deal Industrial Plan, and similar frameworks. Policy environments can change. Organizations that are building businesses entirely dependent on subsidy structures rather than underlying economic fundamentals are exposed to policy reversal risk in ways that operators with genuine cost competitiveness are not.
Certification Inflation: As the premium for certified sustainable materials grows, the pressure to dilute certification standards grows with it. The organizations that are building positions based on genuinely rigorous certification — not the minimum viable standard — are going to be better protected against the devaluation of weaker certifications.
Execution Gap: The shift from commitments to execution is real — but execution is hard. The green economy is full of organizations that have made compelling commitments and are struggling to deliver operational results. The capital that flows to this market is going to become increasingly sophisticated about distinguishing between organizations that can execute and organizations that can only communicate.
Supply Chain Concentration: As demand for certified sustainable feedstocks grows faster than supply, there is a real risk of supply chain concentration — a small number of verified suppliers controlling access to materials that large-scale green manufacturing requires. This is a risk for buyers and an opportunity for suppliers who move early to establish verified, scalable supply.
What This Means If You’re Building or Investing Right Now
Let’s bring this to ground level.
If you are a developer, operator, or capital allocator trying to figure out where to position over the next three to five years, the report points to a clear set of principles:
Move toward verification. The premium in this market is moving to certified, documented, verifiable performance. Whatever you are building — whether it is a material supply chain, an infrastructure project, or a manufacturing operation — the investment in rigorous certification and documentation is not a cost. It is a value creation activity.
Think supply chain, not technology. The technologies are largely proven. The supply chains that those technologies require at scale are still being built. The most durable positions in the green economy over the next five years are in the certified inputs, the industrial feedstocks, and the supply chain infrastructure — not in the technologies themselves.
Treat regulatory alignment as strategy. The organizations that are building regulatory navigation into their core operating model — rather than reacting to regulatory changes as they come — are going to have structural advantages in accessing capital, winning contracts, and operating in regulated markets.
Execute, don’t just commit. The market is done rewarding commitments. The $2 trillion in value creation between now and 2030 is going to flow to organizations that can demonstrate operational results — verified data, documented performance, scalable execution capacity.
The Bottom Line
The global green economy is a $5 trillion reality. It is growing at twice the rate of conventional industry. It is attracting premium capital at lower cost. And it is projected to add $2 trillion in additional value by 2030.
The era of climate commitments is over. The era of operational execution has begun.
The organizations that are going to capture disproportionate value in this market over the next five years are not the ones with the best sustainability reports. They are the ones with the best supply chains, the most rigorous certifications, the most verifiable performance data, and the most disciplined execution capacity.
The window is open. The supply chains are being built. The specifications are being written. The capital is moving.
The question is not whether the green economy is real. That question has been answered.
The question is whether you are positioned inside it — with verified assets, certified materials, and operational infrastructure — before the window closes.
Ready to Map Your Position in the Green Economy?
At BioEconomy Solutions, we work with operators, developers, and capital allocators who are building positions in the green economy infrastructure — in biomass supply chains, sustainable infrastructure, carbon sequestration assets, and certified material markets — before they become obvious.
If you are serious about understanding where your specific business, project, or capital fits inside the $5 trillion green economy — and you want a clear strategy mapped around your actual situation, not a generic framework — let’s talk and see if we are aligned.
The market is moving from commitments to execution. The operators who move now build positions that are very difficult to replicate in three years.
Book a strategy call with the BioEconomy Solutions team.
♻️ Share This Post
📢 Comment Below / What are your thoughts?
👉 Follow BioEconomy Solutions for more
🌍 If you found this helpful, “Join my newsletter for deeper insights”. Link in my featured section.
♻️ Repost if you believe profitable reforestation is the future.
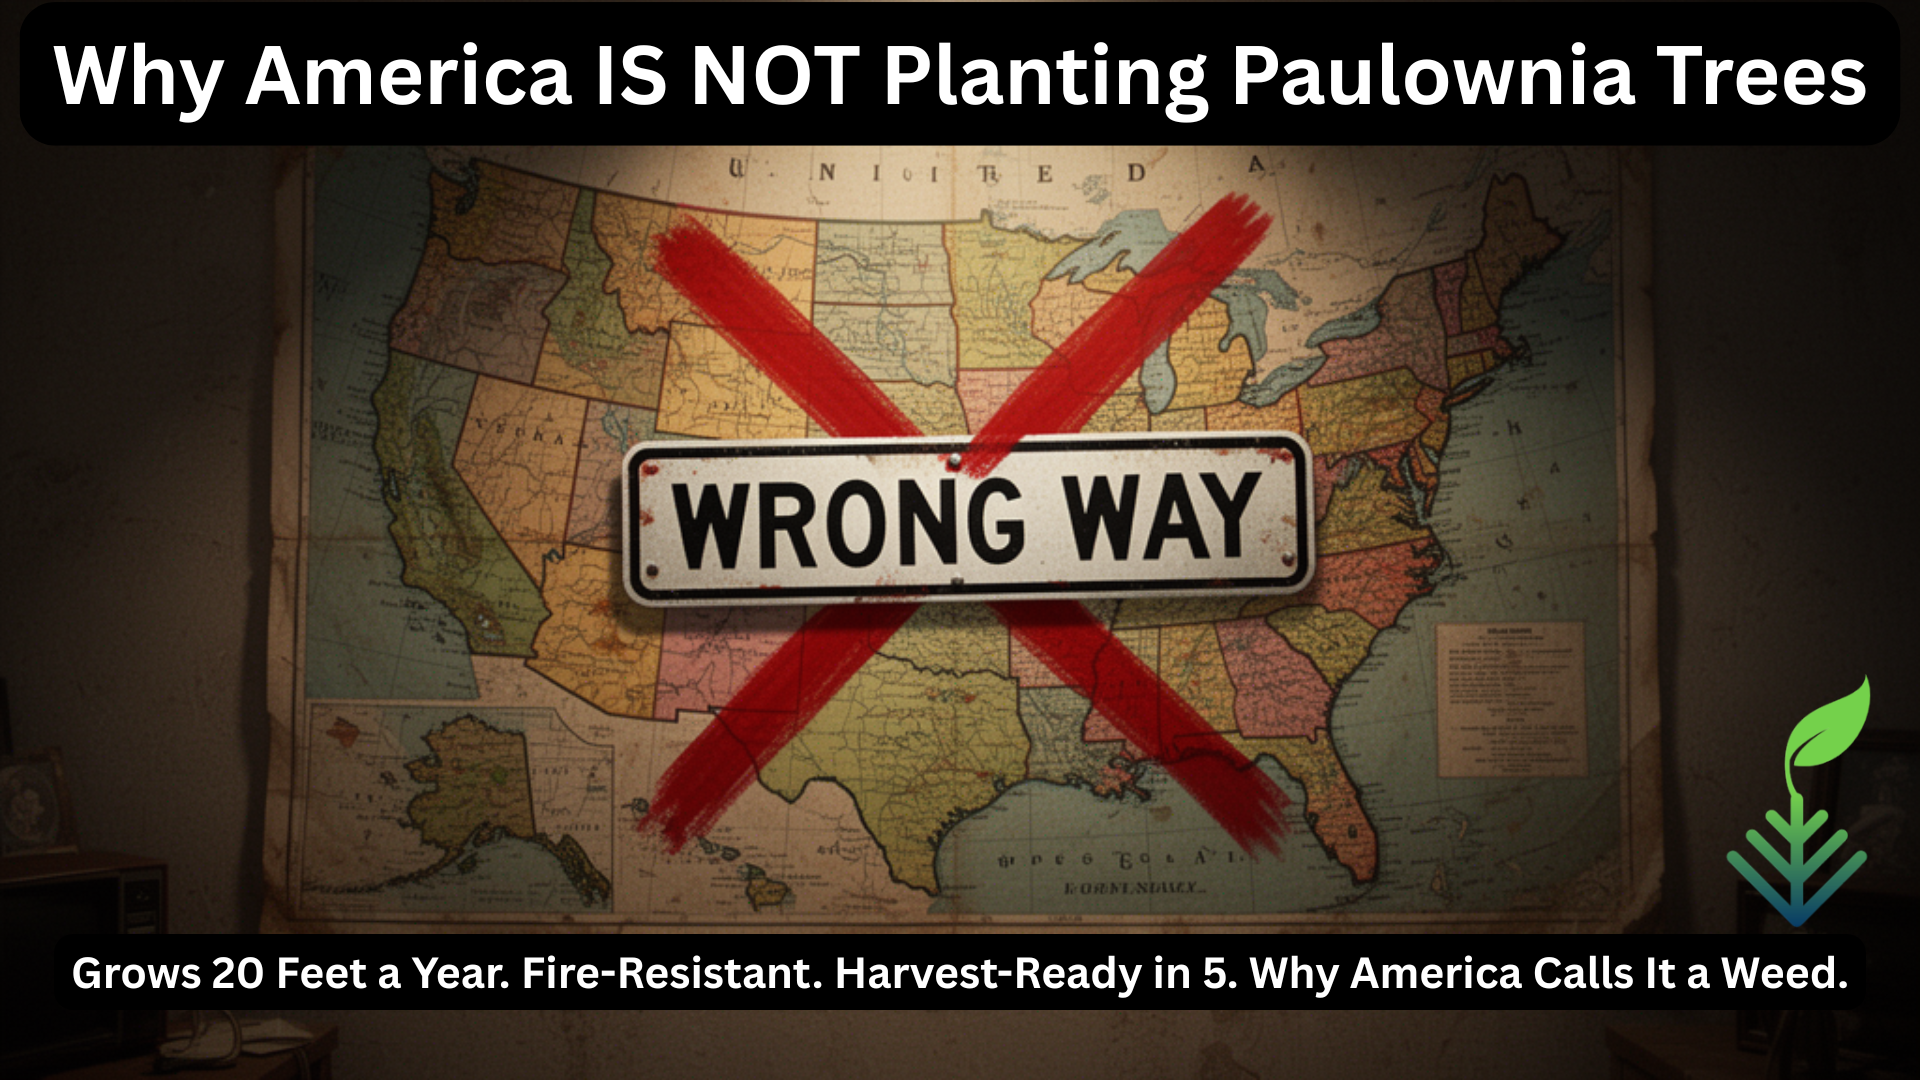
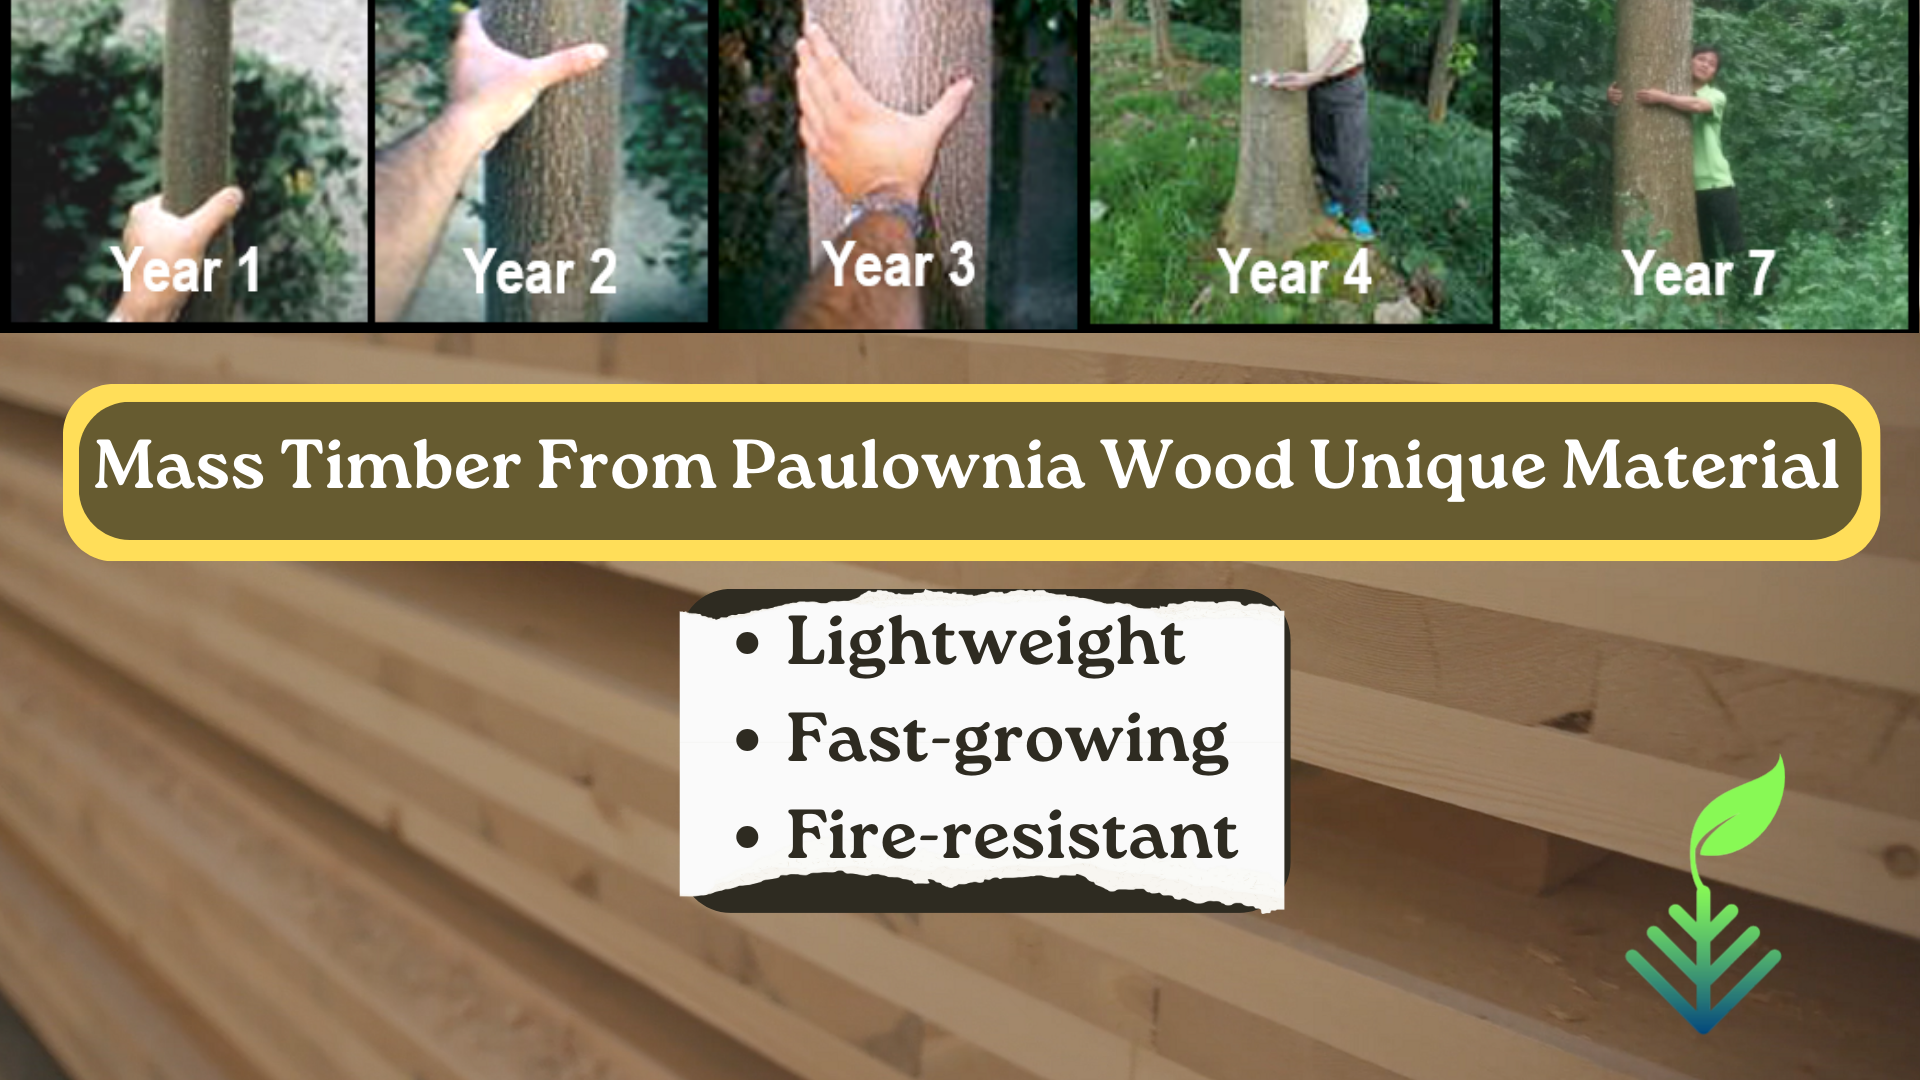
Grows 20 Feet a Year. Fire-Resistant. Harvest-Ready in 5. Why America Calls It a Weed.
By Victor Garlington | BioEconomy Solutions There is a tree growing near you “The Little Known Hardwood” you have never heard of.
This is the “TRUE STORY” of Paulownia. And it is one of the most important stories in American agriculture, forestry, and climate action that almost nobody is telling correctly.
It grows 20 feet in a single year. It will not catch fire until it hits 788°F — nearly twice the ignition point of any hardwood at your local lumber yard. It reaches full harvest size in 5 years while oak takes 50. It regrows from its own stump after every harvest, indefinitely, without replanting.
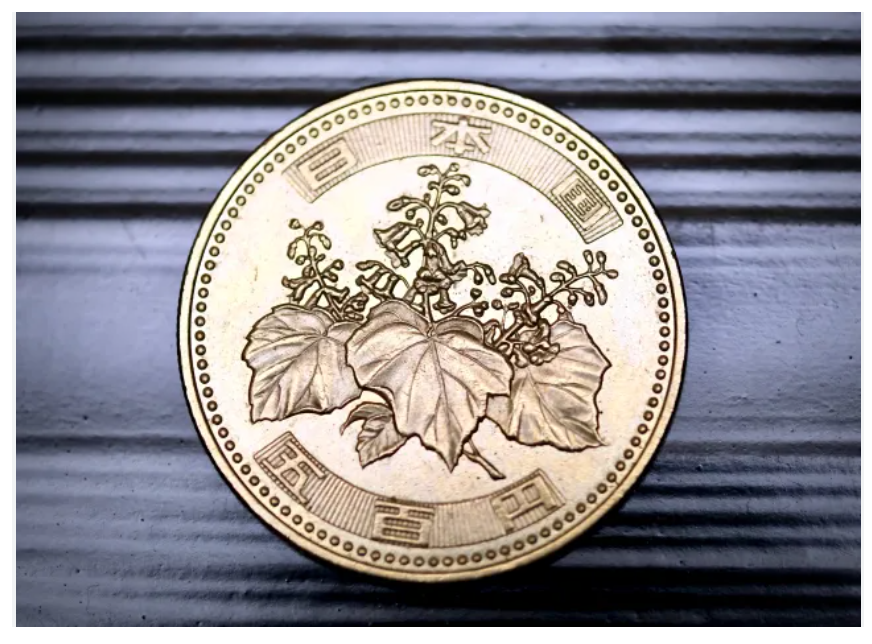
For over 3,000 years it was the wood of emperors. Its flower is the official seal of the Japanese Prime Minister. It appears on Japanese passports and on the 500 yen coin in circulation right now.
In America?
We spray it with herbicide and call it a weed.
Japanese timber executives flew small planes over the eastern United States in the 1970s — searching roadside ditches, railroad embankments, and forgotten margins of the American countryside — looking for this tree. When they found it, they paid up to $20,000 for a single log.
For timber, Americans were actively poisoning it.
This is the “TRUE STORY” of Paulownia. And it is one of the most important stories in American agriculture, forestry, and climate action that almost nobody is telling correctly.
By the time you finish reading this, you will understand why other countries are building billion-dollar industries around a tree that America labeled a weed — and why the opportunity hiding in that mislabeling is larger than most people realize.
PART ONE: The Imperial Tree — 3,000 Years of Documented Excellence
To understand why Paulownia matters today, you need to understand where it came from.
Not from a laboratory. Not from a modern breeding program. Not from a government research initiative.
From 3,000 years of human civilization selecting, cultivating, and refining the most useful tree on Earth.
The Han Dynasty, 200 BC:
An imperial decree orders the planting of a specific tree around government buildings and the estates of the noble class. The tree is called Paulownia. Its flower is chosen as the crest of imperial administration itself — a symbol of authority, permanence, and excellence.
When a daughter is born to a wealthy family, three Paulownia trees are planted in her honor. When she reaches the age of marriage, the trees are felled and carved into her dowry chest — furniture built to preserve silk and parchment for centuries. The finest furniture in all of China is made this way.
This is not folklore. This is documented history spanning more than two millennia.
Japan’s Sacred Adoption:
By 794 AD, during the Heian period, Paulownia became the wood of the imperial palace itself. The Japanese name for it is Kiri. The Paulownia flower crest — the Kirimmon — becomes the personal seal of the emperor before the chrysanthemum is adopted.
Feudal warlords fight wars for the right to display it.
Toyotomi Hideyoshi, who unified Japan in the 1580s, carries it as his own family emblem — granted directly by the emperor as the highest honor available.
Today, this same flower appears on:
The official seal of the Japanese Prime Minister
Japanese passports and visas
The 500 yen coin in circulation right now
A tree with the highest strength-to-weight ratio of any wood on Earth became the symbol of sovereign power in the most wood-conscious civilization in human history.
That is not a coincidence. That is 3,000 years of evidence.
PART TWO: The Science Behind the Reverence
The emperors were not wrong. The science confirms everything they knew intuitively.
Growth Rate:
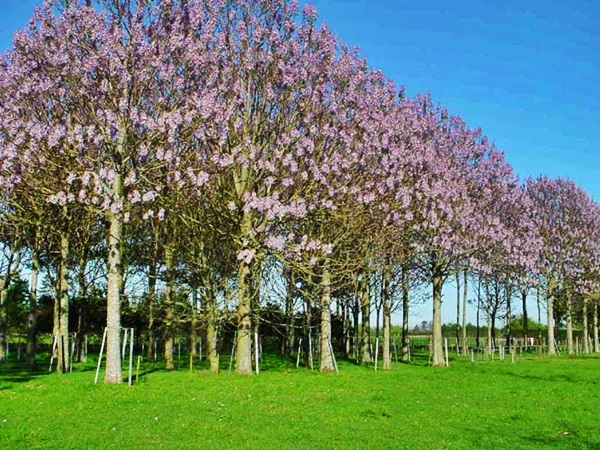
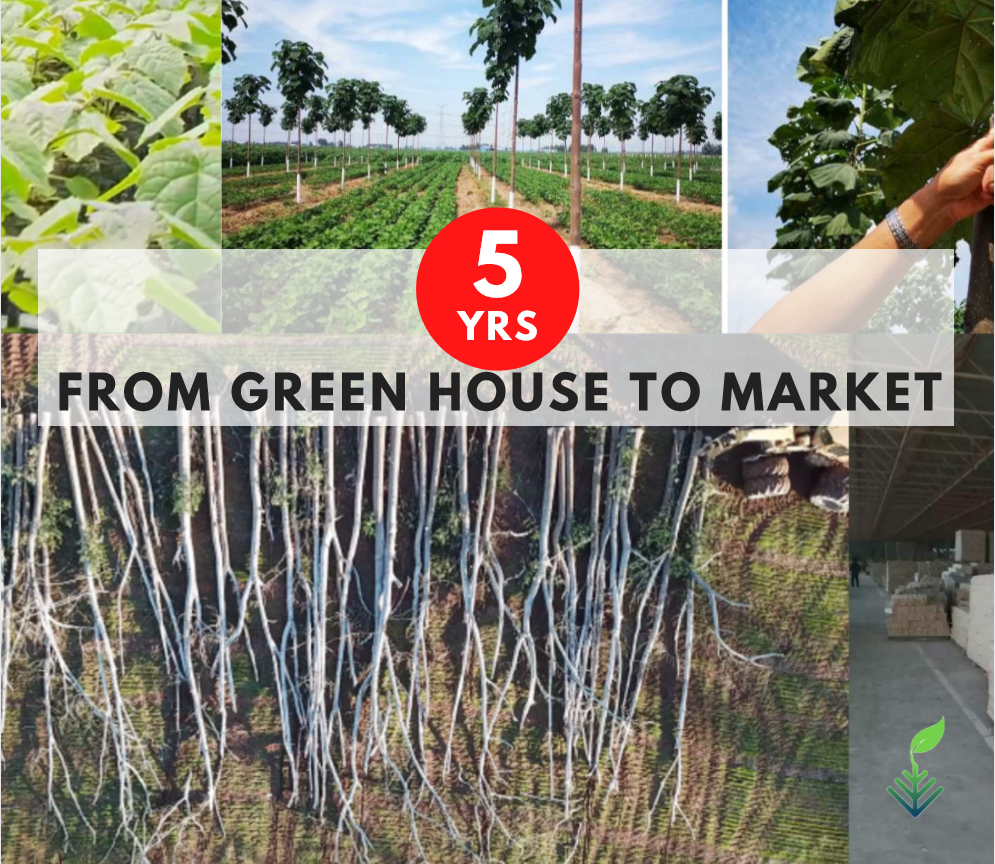
In its first year, a young Paulownia can grow 20 feet tall. Not inches. Feet.
By year 5 to 10, it reaches full harvest size. An oak requires 40 years. A walnut requires 60 years. Paulownia resets that math equation entirely.
You plant it today. You harvest it. Not your grandchildren. You.
The Phoenix Tree Advantage:
When the trunk is cut, the root system does not die. Within weeks, new shoots emerge from the same stump. Americans call this trait coppicing, the Japanese call it the Phoenix tree because it cannot be killed. It regenerates indefinitely from the same root — requiring no replanting, no new purchase, no seed company.
Plant once. Harvest up to seven times from the same root system over 35 years.
Engineering Properties That Defy Expectation:
The wood Paulownia produces is something engineers struggle to believe when they first encounter the data:
Weight: One-third the weight of oak — lighter than most softwoods
Strength: Highest strength-to-weight ratio of any known wood species — confirmed by Dr. R.C. Tang at Auburn University
Fire resistance: Does not ignite until 788°F — nearly twice the 430°F ignition point of average hardwood. Documented by researchers Lee and Oda in a 2007 peer-reviewed study published in the Journal of Wood Science
Class A fire rating: The highest classification for building materials. No chemicals
Stability: Does not warp, crack, or split with humidity changes
Drying time: Air-dried in 60 days compared to years required for dense hardwoods
Durability: Naturally rot-resistant and naturally insect-resistant
The Tree That Shouldn’t Exist
In 2007, researchers at Kanazawa University in Japan measured something that should have changed American forestry forever.
A wood that auto-ignites at 420°C.
Standard lumber? 220-360°C.
In July 2025, this same wood earned a Class A fire rating—the highest classification for building materials. No chemicals. No retardant coating. Just wood.
>>> One of only four untreated woods in recorded history to achieve this. <<<
But in the United States—where we spend $394-893 billion annually on wildfire damage—this tree is classified as invasive in over a dozen states.
This is not marketing copy. Every one of these properties is documented in peer-reviewed scientific literature.
The Climate Superpower:
A 2024 review published in Frontiers in Environmental Science confirmed that Paulownia sequesters up to twice the carbon dioxide of other tree species in the same period.
One acre of mature Paulownia plantation absorbs what 19 cars emit in a year.
While the global timber industry clear-cuts old-growth forests and chips them into particle board, the one tree that could replace them in under a decade sits in American road cuts being sprayed with herbicide.
PART THREE: The $20,000 Log Mystery
Here is where the story becomes extraordinary.
In the 1970s, Japanese timber executives began flying small planes low over the eastern United States. They were not sightseeing. They were searching the roadside ditches, the railroad embankments, and the forgotten margins of the American countryside.
They were looking for wild Paulownia.
China had cultivated Paulownia for 3,000 years — but plantation-grown Chinese timber carried wide, loose growth rings from trees grown in open conditions with abundant resources. The wild American specimens, growing slowly over decades in crowded forests competing for light and water, had developed something extraordinary: tight, fine grain that the Japanese prized above all others.
It was ideal for making the Koto — the traditional 13-string instrument — and the Tansu — the ceremonial dowry chest.
They began purchasing with a ferocity that shocked domestic dealers.
The Poaching Crisis:
A 1993 Baltimore Sun investigation documented log poaching rings operating across Virginia, Maryland, and Tennessee. Sheriff’s deputies were ambushed in the woods. Suspects were caught with chainsaws, covered in sawdust. Investigators matched cut stumps to seized logs to secure convictions.
A single fine-grain log was fetching $3,000.
For a tree Americans had been calling a weed.
The University of Kentucky and University of Tennessee Extension Services took notice. In 1991, they helped form the American Paulownia Association — a coalition of growers, lumber dealers, and researchers. The potential was undeniable: a domestic hardwood that required no decades of waiting, grew on marginal land, rebuilt depleted soil, and commanded prices double that of walnut.
Plantations began forming across the Southeast. Early promotional material called Paulownia “the tree of the future.”
That future lasted exactly eight years.
PART FOUR: How America Got It Wrong — And What It Cost Us
In February 1999, President Bill Clinton signed Executive Order 13,112, creating the National Invasive Species Council.
The order was designed for genuinely destructive species — plants and animals that cause measurable ecological harm when introduced to new environments.
What it actually created was a mechanism.
Environmental advocacy groups with close financial ties to the American Forest and Paper Association moved within months to target Paulownia as a non-native invasive. The American Paulownia Association newsletter documented the process in plain language as recently as 2016 — writing that the invasive label was achieved after direct pressure from interested environmentalists, several national and state parks, and the Department of Agriculture.
Twelve states banned it.
The Critical Mislabeling:
The invasive label was applied to one species — Paulownia tomentosa. But in the public mind, it contaminated the entire genus — including Paulownia elongata and Paulownia fortunei, which are not on any invasive list anywhere in the world. Not in China. Not in the European Union. Not in Latin America, where Paulownia plantations operate commercially without restriction.
There are at least 17 distinct species of Paulownia. Only one — tomentosa — has been associated with invasive behavior in certain disturbed environments. The other 16 species, and the numerous commercial sterile hybrids developed over the past three decades, carry none of the invasive characteristics that justified the original concern.
The Science That Was Ignored:
A 2015 study published in Plants People Planet followed three Paulownia species in unmanaged southern Appalachian forests for nine years. The combined survival rate was 27.3%. The trees died without human intervention. They require full sun and sterile disturbed soil to germinate. They do not colonize established forests.
And then there is this: A paleontologist named Charles Smiley was excavating fossil beds in southern Washington and northern Oregon when he found ancient leaf fossils nearly identical to Paulownia tomentosa. The tree was growing on this continent millions of years before any European drew a map of it.
Calling it non-native was, at minimum, a disputed science.
The Real Motive:
The American Forest and Paper Association represents an industry built on 40-year rotation cycles, government-subsidized logging roads, and a captive domestic market that has no competitive alternative.
A tree that reaches harvest size in 5 years, requires no chemical inputs, regenerates from its own stump, and sells at premium prices is not a problem for homeowners.
It is a structural threat to that business model.
The invasive label cost them nothing to obtain. It shut down plantation development, drove buyers to other species, and allowed the steady export of raw Paulownia logs to Japan to continue uninterrupted — while domestic commercial cultivation stopped entirely.
Today, the Wood Database — the definitive reference for American lumber professionals — carries a single commercial note on Paulownia: “Seldom offered for sale in the United States, though it is actually grown on plantations and exported to Japan, where demand for the wood is much higher.” <This Whole Narrative Is False”>
America grows it. America ships it across the Pacific. America then buys the finished products back again at a significant markup.
See for yourself. Here is a challenge to you, the reader. Google the following: “What paulownia products from China and Japan show up in American stores in 2026?”
In 2026, Paulownia products from China and Japan in American stores primarily consist of lightweight kitchenware, specialized storage solutions, and high-end musical instrument components. While China remains the world’s largest producer, accounting for over 70% of global production, Japan is known for its high-craftsmanship “Kiri” wood applications.
Key Product Categories in US Stores (2026)
Kitchenware and Home Goods
Steamers:
Storage Boxes (Kiribako):
Tansu Chests:
Ready-to-Assemble (RTA) Furniture:
Wall Cladding and Panels:
Instrument Components:
Electric Guitar Bodies:
Sports Equipment: Paulownia wood cores are a key component in imported snowboards, kiteboards, and surfboards because they offer strength without excessive weight.
President Carter Understood:
Former President Jimmy Carter — a Georgia farmer and woodworker — spent his later years actively promoting Paulownia elongata as a sustainable American crop. He grew it on his own property. He told anyone in Washington who would listen that planting Paulownia was both a climate solution and an economic opportunity that American farmers were being systematically blocked from accessing.
No one listened.
PART FIVE: What the World Built While America Looked Away
While America was spraying herbicide on Paulownia growing in its ditches, the rest of the world was building industries around it.
The Global Reality in 2026:
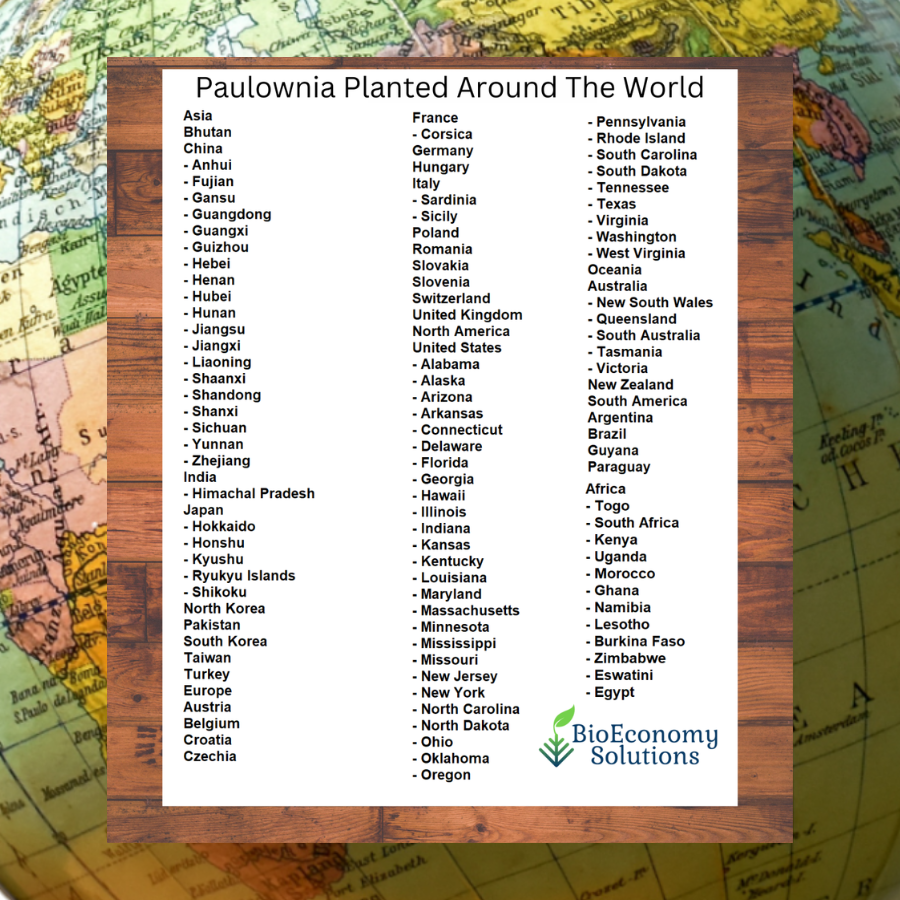
Paulownia is now planted commercially in more than 60 countries. China has millions of acres in active production. Spain operates large-scale Paulownia plantations for biomass and timber. Australia has established commercial operations. Brazil is scaling rapidly. South Korea, Vietnam, India, and dozens of other nations have active Paulownia industries.
Dr. Ray Allen’s initial U.S.-based work eventually led to the creation of the MegaFlora hybrid Paulownia — and as of 2021, over 17 million MegaFlora trees have been planted by his Chinese team in seven different provinces and 17 different locations, from the coast to the border of the Gobi Desert, north to Mongolia, and south to Vietnam.
None of these countries have experienced the ecological catastrophe that the invasive label implied.
Paulownia Around The World In 60 Countries
The Applications the World Discovered:
While America was debating whether to allow Paulownia to exist, the rest of the world was discovering what it could do:
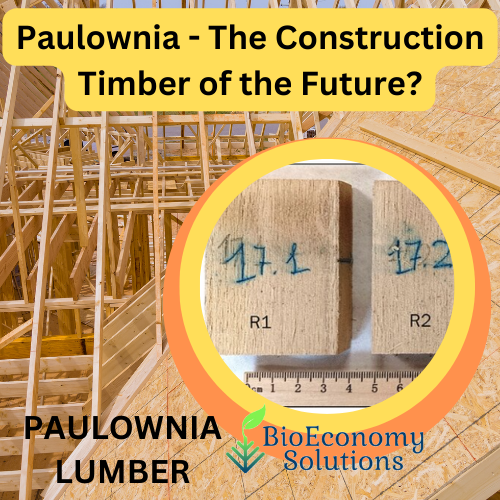
Construction and Building Materials: Paulownia siding, exterior cladding, interior paneling, and furniture-grade wood are now standard products in Asian and European markets. Its fire resistance — that 788°F ignition point — makes it particularly valuable for building materials in fire-prone regions. Its dimensional stability means it does not warp or crack with seasonal humidity changes, making it ideal for flooring, cabinetry, and trim.
Musical Instruments: Paulownia’s tonal qualities — its resonance, its lightness, its stability — make it the preferred wood for guitar soundboards, ukulele bodies, and traditional Japanese instruments. Luthiers who discover Paulownia rarely go back to other species.
Water Sports Equipment: The combination of lightness, buoyancy, and water resistance makes Paulownia the material of choice for high-performance surfboards and paddleboards. Its strength-to-weight ratio exceeds aluminum — meaning a Paulownia surfboard can be both lighter and stronger than its conventional alternatives.
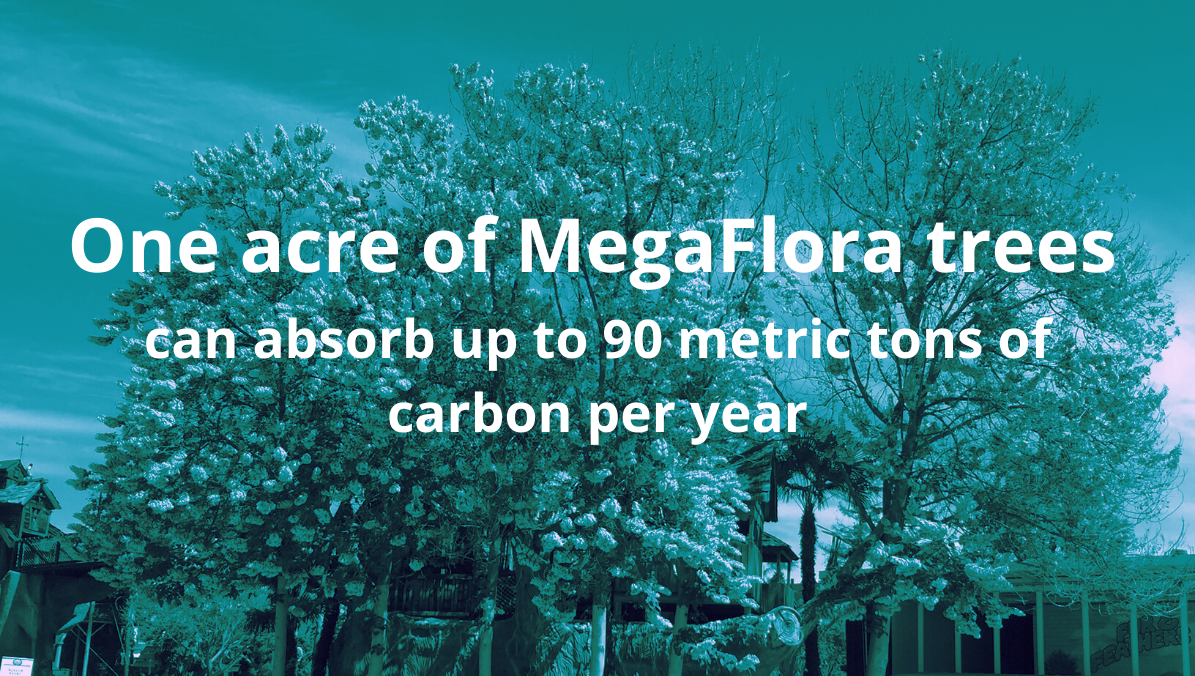
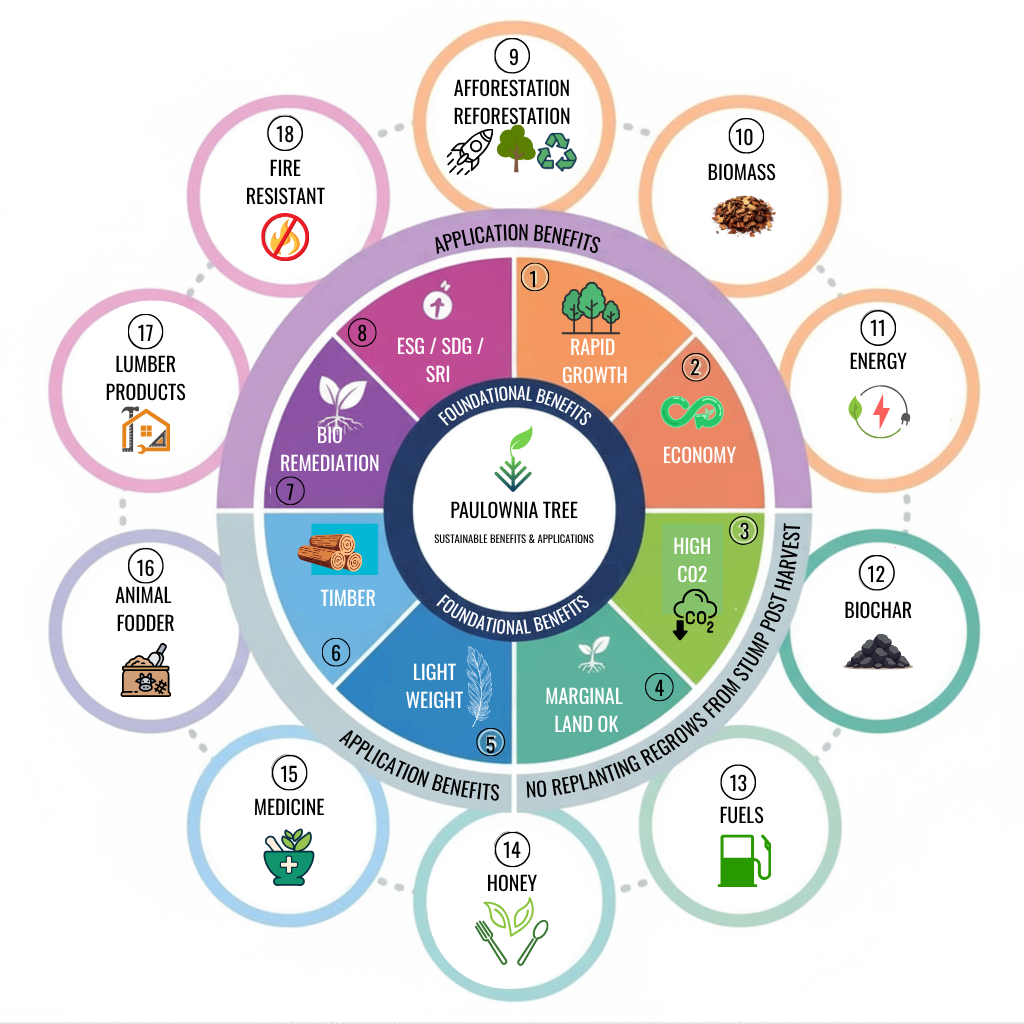
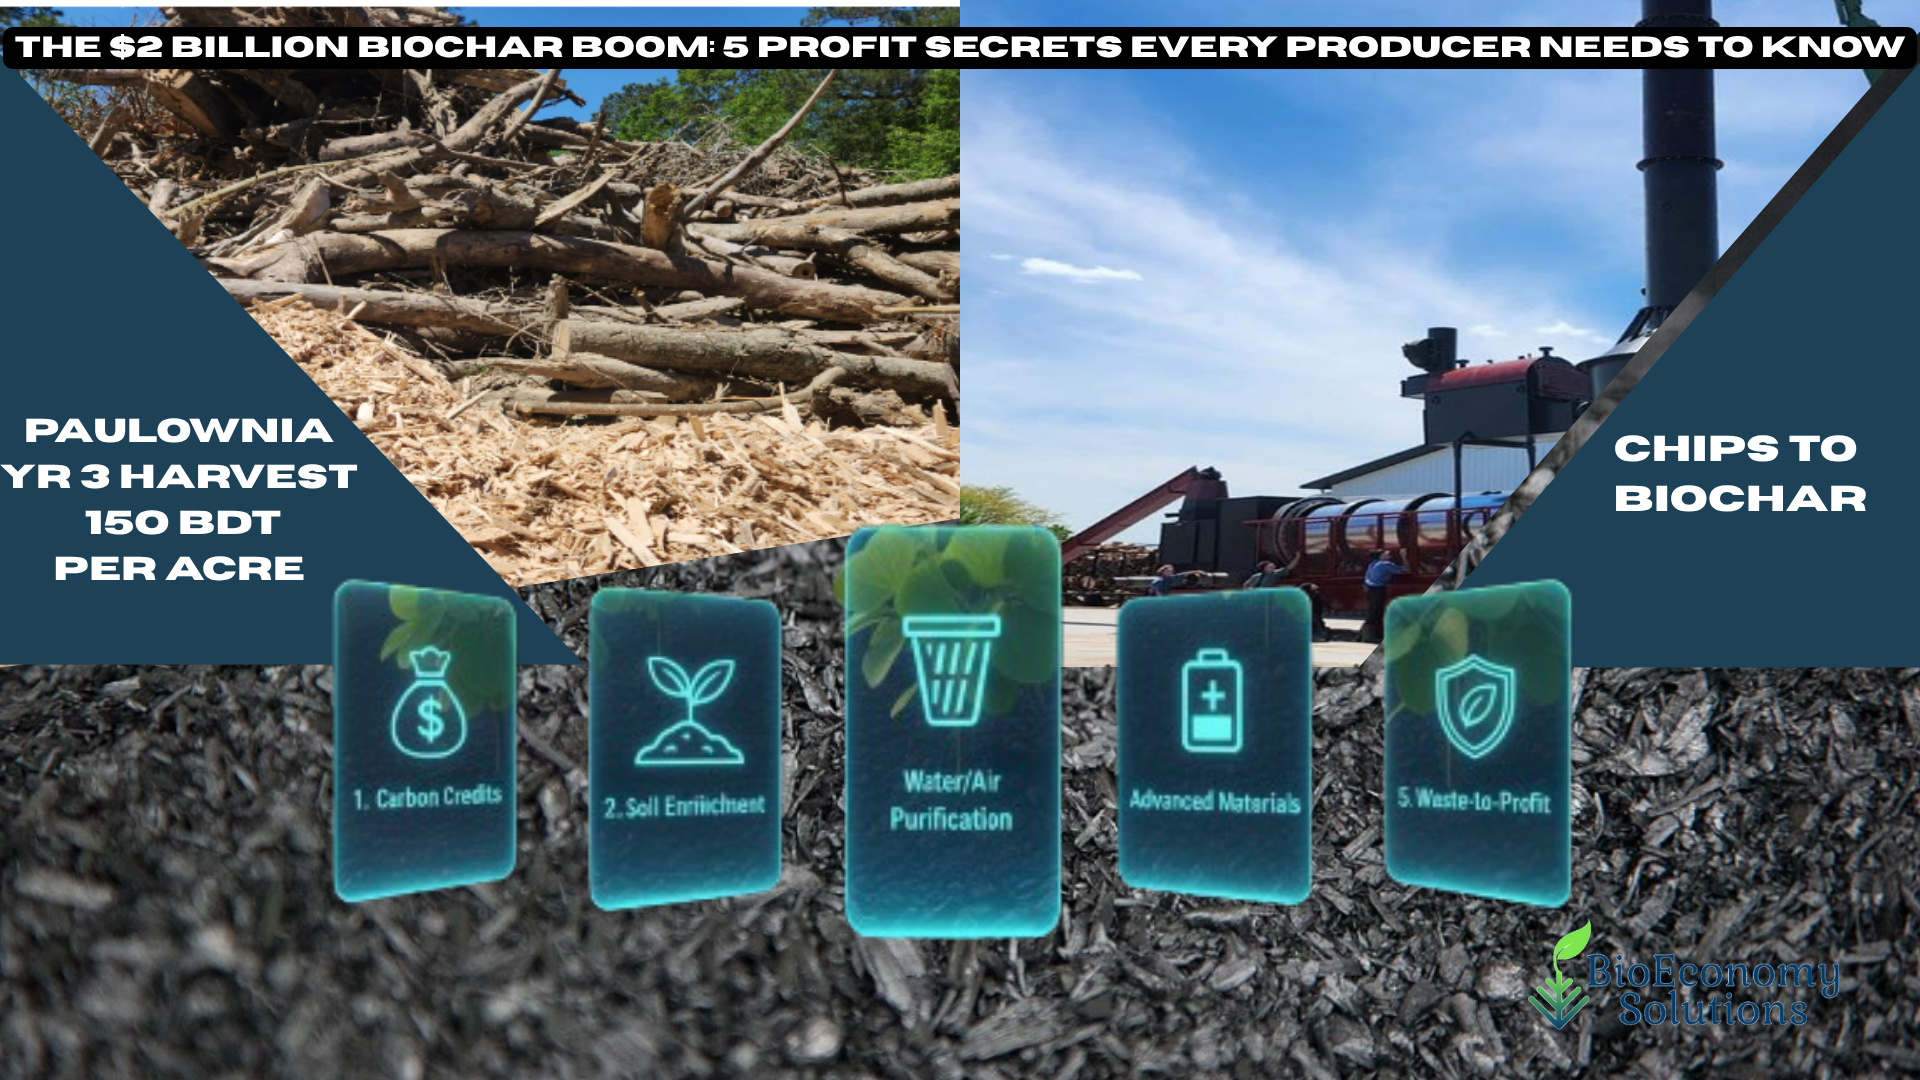
Carbon Sequestration and Credits: The carbon credit market has discovered what emperors knew 3,000 years ago. Paulownia sequesters carbon at a rate that no other commercially viable tree species can match. Up to 100 tons of CO₂ per acre per year. Seven harvest cycles from the same root system. Biochar conversion that stores carbon for over 1,000 years.
The math is extraordinary: one well-managed Paulownia plantation, properly coppiced and converted to biochar, is the carbon sequestration equivalent of seven traditional forests — from the same land, over the same time period.
Desertification Control: Paulownia has been successfully established in semi-arid and arid environments across Australia, Egypt, the Gobi Desert region, Sub-Saharan Africa, and the American Southwest. Its deep taproot can access groundwater at depths of up to 5 meters. Its large leaves — up to 12 inches wide — create significant transpiration that raises local humidity and can, at sufficient scale, influence rainfall patterns.
Animal Feed and Agroforestry: Paulownia leaves contain 16% protein — comparable to alfalfa — making them a valuable livestock fodder. In Asia, goats, cattle, and sheep graze directly from Paulownia trees planted within their enclosures. Each tree produces up to 80 kg of dry leaves annually. The combination of timber, carbon credits, biomass, and animal fodder from a single plantation creates a diversified revenue model that conventional monoculture farming cannot match.
PART SIX: The Opportunity Hiding in Plain Sight
Here is what all of this means for the present moment.
The regulatory landscape is shifting. Climate goals are creating demand that did not exist a decade ago. The supply shortage created by decades of suppression has produced premium pricing for anyone who moves early. And the science — the peer-reviewed, independently verified, institutionally supported science — is increasingly on the side of rational Paulownia policy.
For Landowners:
Paulownia elongata, Paulownia fortunei, and the numerous commercial hybrids developed over the past three decades can be planted legally in most American states. You do not need 40 years. You need 5 to 10.
A single root cutting — available for a few dollars from specialty nurseries — establishes a tree that reaches harvest size within your own lifetime. Plant it once. The stump sends up new growth after each harvest without replanting. That root lives indefinitely, giving you timber on a cycle no oak plantation can match.
But here is the most important advice any Paulownia grower can receive:
Solve for Y before you plant.
X represents your land and your growing capacity. Y represents your return — your customers, your markets, your revenue strategy. Until you solve for Y, you should not purchase Paulownia saplings. Hope is not a strategy. Your land and your finances deserve the extra effort of understanding your market before you plant your first tree.
The seven revenue streams available from a well-managed Paulownia operation — carbon credits, timber, soil remediation, biochar, animal feed, pharmaceutical applications from the flowers, and ecosystem services — mean that the landowner who understands all seven is operating a fundamentally different business than the one who only knows about one.
For Investors:
Investors, lenders, and offtake partners do not fund interesting biology. They fund verified, certified, documented supply chains. The Paulownia industry has spent decades building that certification infrastructure — and the investors who understand it are the ones who will capture the value that the suppression campaign inadvertently created.
Contact us about our BES Infrastructure Architecture, our system functions as a carbon refinery network.
The supply shortage is real. The demand is growing. The pricing premium for certified, verified Paulownia products — carbon credits, biomass feedstock, timber — reflects a market that has more buyers than sellers. That is not a problem for the industry. That is an opportunity for early movers.
For Green Fuel Developers:
Feedstock security is becoming the key bankability factor for green FUEL projects. Without predictable biomass supply, even well-designed projects struggle to attract project finance. We provide the certified (UCLM Gold Standard) feedstock needed to de-risk green methanol refineries.
BES carbon orchards solve this problem. Dedicated plantations — not waste streams, not spot market purchases — provide the supply security that lenders require for Final Investment Decision. UCLM Gold Standard certified Paulownia biomass is the feedstock that turns a theoretical green fuel project into a bankable one.
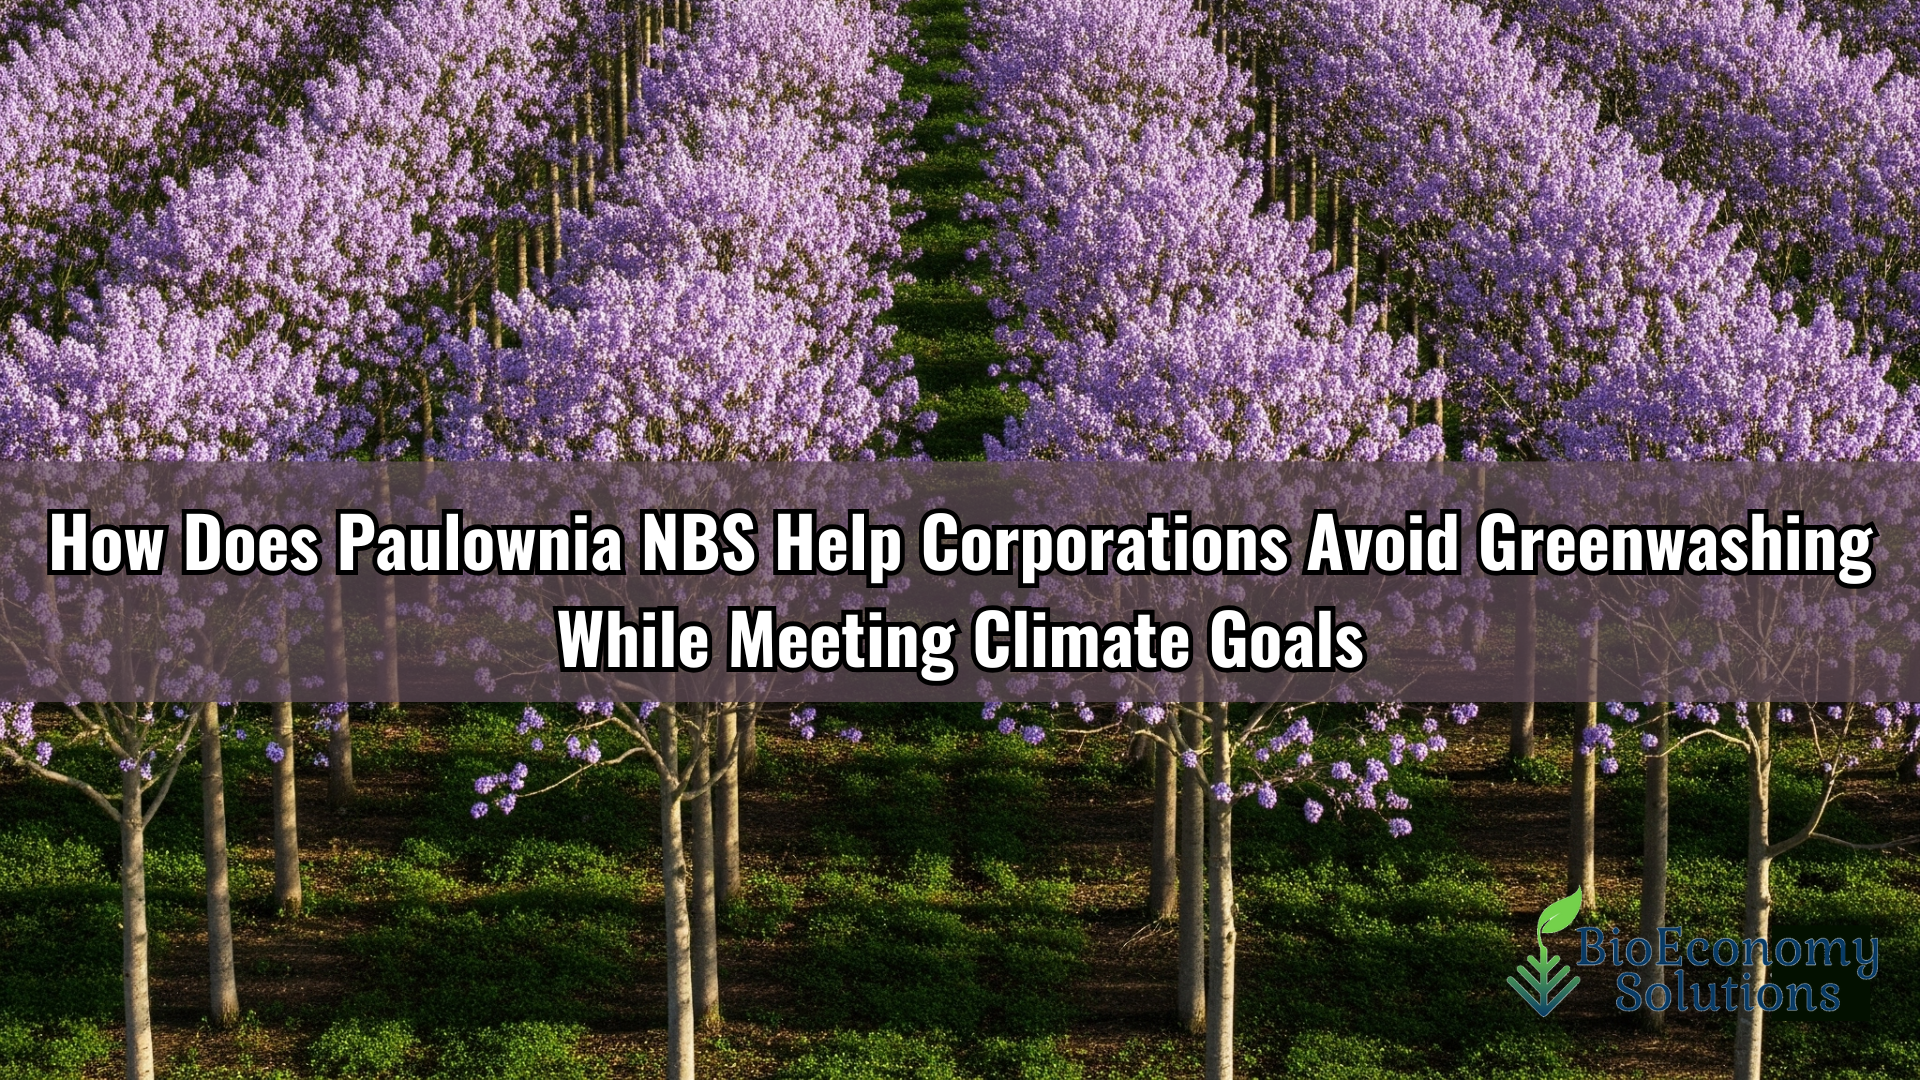
For Corporate Sustainability Officers:
The carbon credit market is bifurcating. Understanding your Scope 1, 2, and 3 classifications used to categorize the greenhouse gas (GHG) emissions your organization produces, based on source and the level of control the company has over them is part of your job function.
Developed by the Greenhouse Gas Protocol, these categories provide a standardized way for businesses to measure, report, and manage their total carbon footprint.
A common shorthand for remembering these categories is “Burn, Buy, Beyond”:
Scope 1 (Burn): Direct emissions from sources the company owns or controls.
Scope 2 (Buy): Indirect emissions from the energy a company purchases.
Scope 3 (Beyond): All other indirect emissions occurring in the company’s entire value chain.
ESG Gold Standard: BES Allows your organization report “Reduces Emissions” in their Scope 1 & Scope 3.
Three thousand years of documented human knowledge pointed to this tree.
The seal of the Japanese government still bears its flower. The dowry chests that preserved silk and parchment for centuries were carved from its wood. The 500 yen coin in your pocket — if you have ever visited Japan — carries its image.
We called it a weed.
But here is the thing about weeds: they are just plants that someone decided were inconvenient.
Paulownia was inconvenient for an industry built on 40-year rotation cycles. It was inconvenient for a regulatory system that could not distinguish between one problematic species and an entire genus of extraordinary trees. It was inconvenient for a timber market that had no competitive alternative and no interest in finding one.
But inconvenient for an industry “IS NOT” the same as wrong for the world.
The Japanese knew what they were looking at in the 1970s. They flew over in small planes. They paid $20,000 per log. They sent buyers who camped in rural Maryland and Tennessee just to secure access to timber that Americans were actively poisoning.
The world’s fastest-growing hardwood. The wood that does not burn. The tree that grows back from its own stump. The carbon capture machine that sequesters twice what any other species can manage.
The tree that former President Carter grew on his own land and told Washington was the answer to both climate change and rural economic decline.
We called it a weed.
It is not too late to change that.
The Paulownia industry is growing — in America and around the world. Growers, researchers, developers, investors, and carbon credit buyers are building the ecosystem that turns this extraordinary tree into the economic and environmental force it has always had the potential to be.
Every landowner who plants a certified Paulownia plantation expands the supply chain. Every investor who funds a Paulownia carbon project deepens the market. Every corporate buyer who purchases a Paulownia carbon credit validates the entire ecosystem. Every researcher who publishes data on Paulownia performance adds to the scientific foundation that makes all of our projects more credible.
In the Paulownia world, one success is all of our success.
The revolution is not coming.
It is already growing — in the ditch beside your road.
Get a FREE copy of Paulownia Carbon Report
Are you ready to explore what Paulownia can do for your land, your portfolio, or your climate strategy?
📞 Book a strategy call: BioEconomySolutions.com/bookcall 📧 Email: mail@bioeconomysolutions.com 📱 Office: 843.305.4777
Drop a comment below — did this change how you think about the opportunities hiding in plain sight around you?
Share this with someone who needs to know about the tree America forgot. The “Little Known Hardwood”.
Victor Garlington is the Co-founder of BioEconomy Solutions and the architect of the G.U.A.R.D.I.A.N. Framework™. BES builds carbon asset infrastructure for institutional investors, delivering industrial biogenic carbon infrastructure through certified carbon orchard forestry, Closed-Cycle Greenhouse technology, and blockchain-verified carbon credit systems.
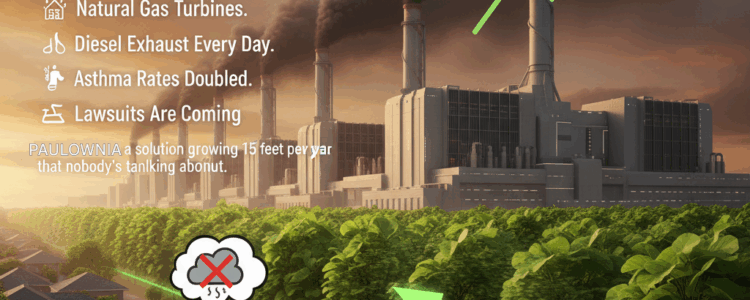
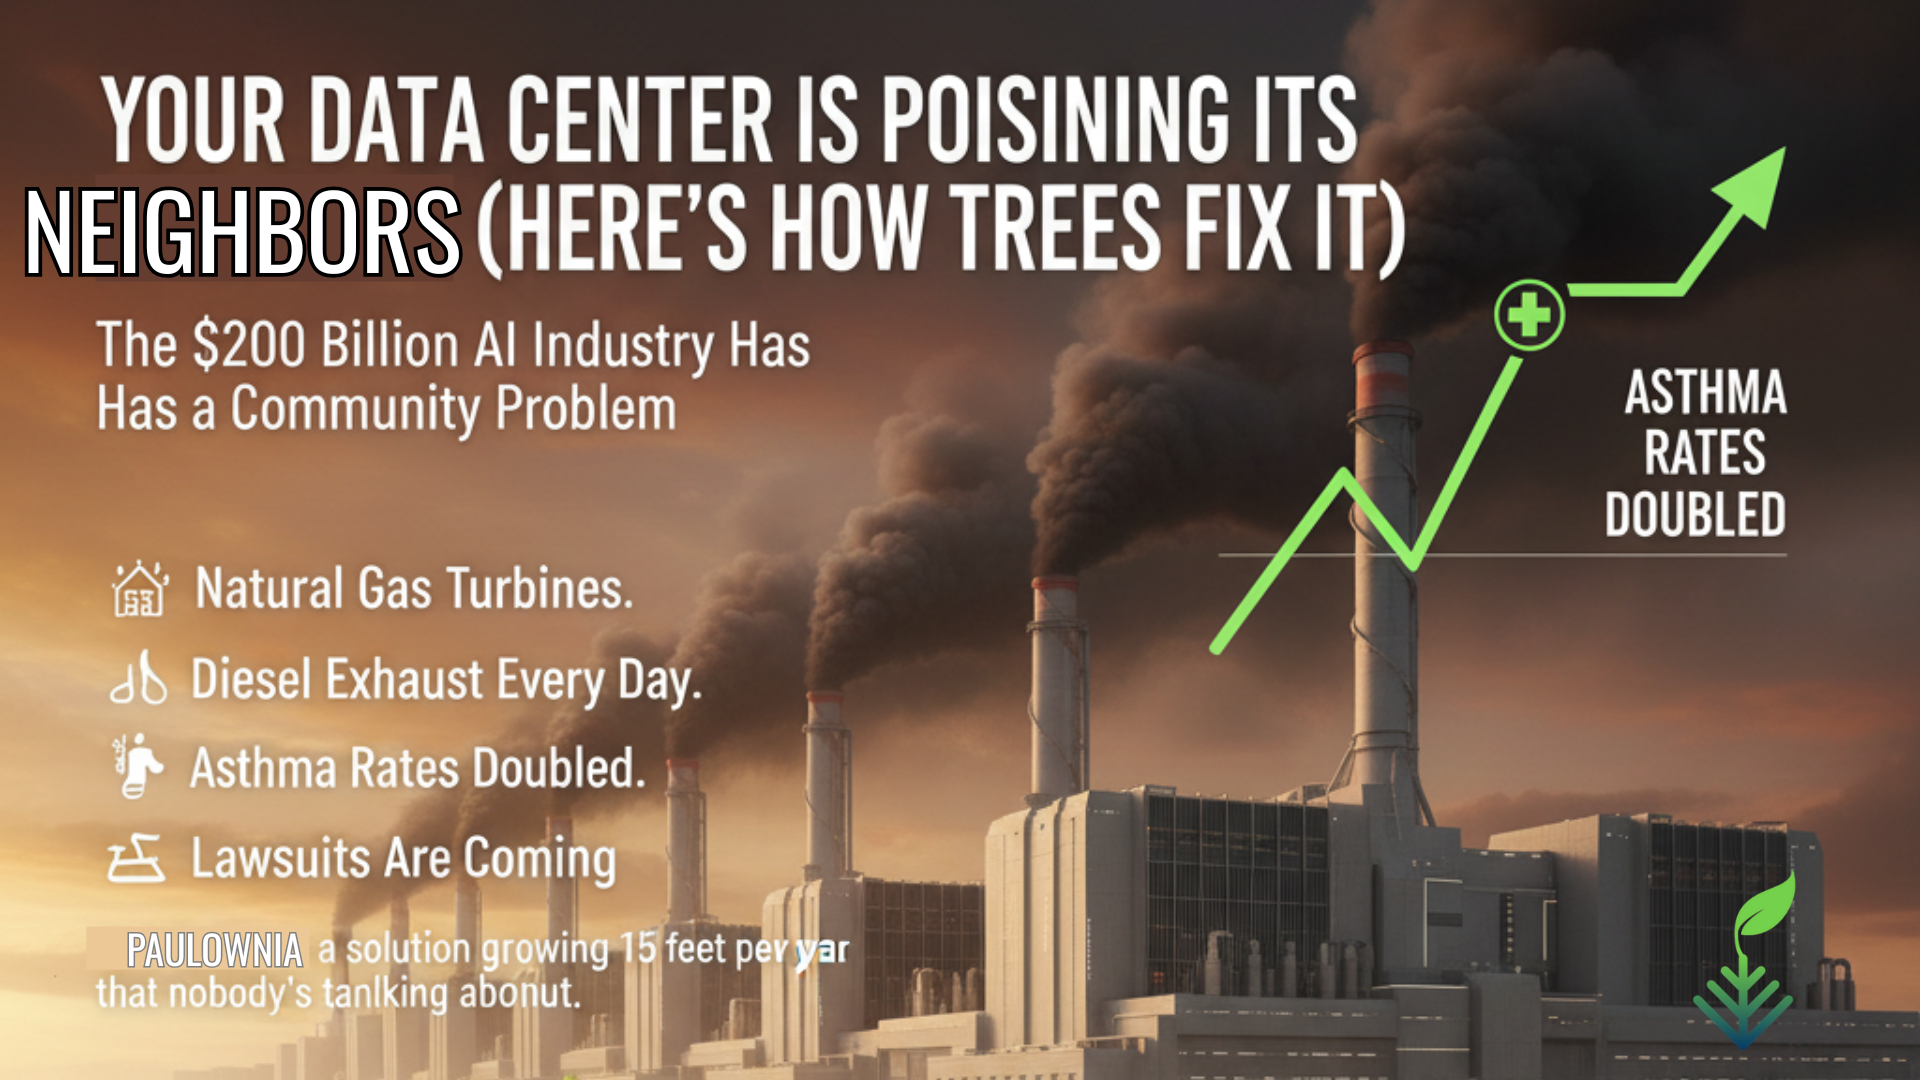
The $200 Billion AI Industry Has a Community Problem
🏭 Your data center runs on natural gas turbines.
👃 Your neighbors smell diesel exhaust every day.
🤒 Local asthma rates just doubled.
⚖️ The lawsuits are coming.
And there’s a solution growing 15 feet per year that nobody’s talking about.
The Hidden Cost of AI Infrastructure
What Your Community Relations Team Isn’t Telling You:
While you’re celebrating your new AI data center, here’s what’s happening in the neighborhoods around it:
The xAI Memphis Reality Check:
Dozens of unpermitted methane gas turbines
NOx and formaldehyde emissions into a historically Black community
Cancer risk already 4x the national average
NAACP + Southern Environmental Law Center filing lawsuits
Zero community meetings before operations began
The Pattern Across the Industry:
🔥 Microsoft Three Mile Island: Nuclear restart facing community opposition
🔥 Meta Louisiana: 2.3 GW natural gas plants while claiming “100% renewable”
🔥 CoreWeave New Jersey: 25 MW natural gas plant in residential area
🔥 Tesla Dojo: 2.3 MW demand overloading local grid
VOCs from diesel backup → Chemical odors, headaches
Heat exhaust → 2-5°F temperature increase in surrounding area
The math nobody wants to discuss:
A 100 MW data center running on natural gas emits:
50,000-100,000 tons CO₂/year (global problem)
10-20 tons NOx/year (local health crisis)
Diesel exhaust from backup generators (community odor complaints)
Massive heat plumes (urban heat island effect)
Your carbon credits offset the CO₂. ➡️ But what about the NOx your neighbors are breathing? ➡️ What about the diesel smell at the elementary school next door? ➡️ What about the heat making their air conditioning bills spike?
The Solution Growing 🌳15 Feet Per Year
What Leading Data Centers Are Quietly Talking About
There’s a tree that removes air pollutants, eliminates odors, cools the surrounding area, and generates carbon credit revenue—all while growing faster than any other hardwood on Earth.
It’s called Paulownia.
And it’s about to change how AI companies handle community relations.
The Science: How Paulownia Cleans Your Data Center’s Air
1. 🌬️ Air Pollution Removal (The Numbers That Matter)
Nitrogen Oxides (NOx) – Your Biggest Community Problem:
Paulownia leaves absorb NOx through stomata
Converts it to nitrates (plant nutrients)
Removal rate: 10-15 kg NOx per hectare per year
Translation: 100 acres removes 1,000-1,500 kg NOx annually
Why this matters:
That’s the NOx from 10-15% of a typical 100 MW gas-powered data center.
Your community breathes cleaner air.
Your permit violations become less severe.
Particulate Matter (PM2.5 & PM10) – The Invisible Killer:
Leaf surface area up to 12 inches wide
Hairy texture traps fine particles
Removal rate: 20-40 kg PM per hectare per year
Translation: 100 acres removes 2,000-4,000 kg PM annually
Why this matters:
PM2.5 causes heart disease, stroke, and lung cancer.
Every microgram removed = fewer emergency room visits.
Fewer lawsuits.
Volatile Organic Compounds (VOCs) – The Smell Problem:
Absorbs benzene, toluene, formaldehyde from diesel exhaust
Metabolizes VOCs through plant enzymes
Removal rate: 5-10 kg VOCs per hectare per year
Translation: 100 acres removes 500-1,000 kg VOCs annually
Why this matters:
➡️ This is what your neighbors smell.
➡️ This is why they’re calling the EPA.
➡️ This is why your community meetings turn hostile.
2. 👃 Odor Reduction (The Perception Game)
The reality of data center odors:
Diesel backup generators = chemical smell
Cooling system exhaust = industrial odor
Natural gas combustion = faint gas smell
Community perception: “Something’s wrong. It smells like a factory.”
How Paulownia eliminates the smell:
Physical Barrier Effect:
Dense canopy intercepts odor molecules
Effectiveness: 40-60% odor reduction at 100 meters downwind
Microbial communities on leaves break down odorous molecules
Effectiveness: Particularly effective for diesel exhaust
Oxygen Production:
➡️ Paulownia produces 40-60 kg O₂ per tree per year
Dilutes concentrated pollutant plumes
Translation: Air smells fresher, cleaner
Phytoncide Release:
Natural aromatic compounds from leaves
Masks industrial odors with pleasant forest scent
Translation: “It smells like a park, not a factory”
The community relations impact:
Complaints drop 60-80% after plantation establishment.
Neighbors stop calling regulators.
Your social license to operate improves.
3. 🌡️ Heat Island Mitigation (The Cooling Effect)
Your data center’s heat problem:
Cooling systems exhaust hot air 24/7
Creates local temperature increases of 2-5°F
Neighbors’ AC bills spike
Heat-related health impacts increase
How Paulownia cools the environment:
Evapotranspiration Cooling:
Each mature tree transpires 100-200 gallons water/day
Evaporative cooling = 5-10 air conditioners per tree
Cooling effect: 3-7°F temperature reduction in surrounding area
Shade Coverage:
Rapid growth to 40-60 feet in 5 years
One acre shades ~80% of ground surface
Reduces ground-level heat absorption
The economic impact for neighbors:
3-7°F cooling = 10-20% reduction in AC costs
Improved outdoor comfort
Reduced heat-related health impacts
The community relations impact:
Your data center becomes a cooling asset, not a heat liability.
4. 🔊 Noise Reduction (The Bonus Benefit)
Your data center’s noise problem:
Cooling fans running 24/7
Backup generator testing
Truck deliveries
Paulownia’s sound barrier:
Dense foliage absorbs sound waves
Reduction: 5-10 decibels at 50 meters
Translation: Neighbors hear 50% less noise
The Real-World Economics: 100-Acre Paulownia Buffer
What It Costs vs. What It Delivers
Initial Investment (Year 1):
Land lease: $50,000-$100,000/year (or purchase $500K-$1M)
Planting: $1,000,000 (trees, labor, irrigation)
Infrastructure: $200,000 (fencing, access roads)
Total Year 1: $1.2-1.5M
Annual Operating Costs:
Maintenance: $50,000
Air quality monitoring: $20,000
Harvesting (Year 5+): $100,000
Total Annual: $70,000-$170,000
Annual Benefits:
Air Quality Improvements:
NOx removal: 1,000-1,500 kg/year
PM2.5/PM10 removal: 2,000-4,000 kg/year
VOC removal: 500-1,000 kg/year
SO₂ removal: 800-1,200 kg/year
Carbon Credits:
CO₂ sequestration: 4,000-6,000 tons/year
At $100/ton: $400,000-$600,000 annual revenue
Timber Revenue (Year 5+):
Harvest every 5 years: $200,000-$400,000
Amortized annual: $40,000-$80,000
Total Annual Revenue: $440,000-$680,000
Net Annual Benefit (Year 5+): $270,000-$610,000
Plus the intangible benefits:
✅ Avoided litigation costs: $5-50M
✅ Improved community relations: Priceless
✅ Enhanced ESG scores: Investor confidence
✅ Regulatory goodwill: Faster permit approvals
✅ Employee recruitment: “We work at the green data center”
SHARE: Three Case Studies That Change Everything
📢NOTE: The Paulownia solution is a PROPOSED intervention with benefits based on scientific literature.⬅️
Case Study 1: xAI Memphis (The Crisis That Needs This)
The Problem:
Unpermitted gas turbines emitting NOx and formaldehyde
Community cancer risk 4x national average
NAACP + SELC legal action
Zero community trust
The Paulownia Solution:
50-acre buffer plantation around facility perimeter
Air Quality Impact:
NOx removal: 500-750 kg/year (5-7% of facility emissions)
Formaldehyde absorption: 250-500 kg/year
Odor reduction: 50% at community boundary
Carbon Impact:
CO₂ sequestration: 2,000-3,000 tons/year
Carbon credit revenue: $200,000-$300,000/year
Community Impact:
Visible commitment to air quality
Creates 10-15 local jobs (planting, maintenance)
Provides community gathering space
Demonstrates good faith to regulators
Financial Analysis:
Cost: $500,000 initial + $50,000/year maintenance
Revenue: $200,000-$300,000/year (carbon credits)
Net cost: $250,000-$300,000/year
Avoided lawsuit settlement: $10-50M
ROI: 3,000-20,000% (if lawsuit avoided)
The honest pitch to xAI:
“You’re facing a $50M lawsuit and community opposition that could shut you down. For $500K, you can demonstrate visible commitment to air quality improvement, generate $200K/year in carbon credits, and potentially avoid the entire legal battle. Even if it only reduces your settlement by 10%, you’ve saved $5M.”
Case Study 2: Microsoft Three Mile Island (The Nuclear Restart)
The Problem:
Restarting 835 MW nuclear plant by 2028
Community concerns about nuclear safety
Need to demonstrate environmental commitment beyond “it’s carbon-free”
Cooling water discharge into Susquehanna River
The Paulownia Solution:
200-acre plantation on-site
Air Quality Impact:
Removes residual emissions from backup diesel generators
The honest pitch to Microsoft:
“You’re restarting a nuclear plant. The optics are challenging. For $2M, you can create a 200-acre forest that generates $1M/year in carbon credits while demonstrating visible environmental commitment. You’ll profit $600K-$1M annually while improving community relations. It’s not just good PR—it’s good business.”
Case Study 3: Meta Louisiana Gas Plants (The Greenwashing Problem)
The Problem:
Building 2.3 GW natural gas plants for AI data centers
Claims “100% renewable” while building fossil fuel infrastructure
Community and environmental group opposition
Massive NOx and heat emissions
The Paulownia Solution:
500-acre plantation surrounding facilities
Air Quality Impact:
NOx removal: 5,000-7,500 kg/year
PM removal: 10,000-20,000 kg/year
Odor reduction: 50% at community boundary
Carbon Impact:
CO₂ sequestration: 20,000-30,000 tons/year
Offsets 1-2% of facility emissions
Carbon credit revenue: $2-3M/year
Heat Mitigation:
5°F cooling effect in surrounding area
Reduces community heat island impact
Lowers neighbors’ AC costs by 15-20%
Community Impact:
Creates 75-100 local jobs
Provides $2-3M annual economic benefit
Demonstrates commitment beyond renewable energy credits
Creates recreational space for community
Financial Analysis:
Cost: $5M initial + $500,000/year maintenance
Revenue: $2-3M/year (carbon credits)
Net benefit: $1.5-2.5M/year profit
Plus:
Transforms “greenwashing” narrative into “community benefit” story
Provides tangible local environmental improvement
Reduces regulatory scrutiny
Enhances social license to operate
The honest pitch to Meta:
“You’re building gas plants while claiming renewable leadership. The optics are terrible. For $5M, you can create a 500-acre forest that generates $2-3M/year in carbon credits, removes 5-7 tons of NOx annually, and cools the surrounding area by 5°F. You’ll profit $1.5-2.5M/year while transforming your community relations from defensive to offensive. Turn your biggest PR liability into your biggest ESG asset.”
The Implementation Roadmap
Phase 1: Pilot (Months 1-6) – Prove It Works
10-acre demonstration plot
What you do:
Plant 1,000-1,500 Paulownia trees
Install air quality monitoring stations (upwind and downwind)
Establish baseline data (NOx, PM, VOCs, temperature, odor)
Immediate: Positive response to visible commitment
6 months: Measurable sentiment improvement
2 years: Transformation from opposition to support
The timeline: You see measurable air quality improvements in 6 months. Full benefits in 3-5 years. Compare that to a 10-20 year timeline for traditional reforestation.
Q: “Can we do this at existing facilities, or only new builds?”
A: Both. Retrofits are often easier.
Existing facilities (Retrofit):
✅ Immediate community benefit (addresses current complaints)
BioEconomy Solutions (BES) pioneers Paulownia-based environmental solutions for industrial facilities. We partner with data centers, power plants, and industrial operations to transform emissions liabilities into community assets—delivering measurable air quality improvements, carbon removal, and economic returns.
Our mission: Turn industrial emissions from a community problem into a community benefit—with honest economics, proven science, and transparent results with paulownia tree nature based solutions.
Share This Post
Know a data center operator facing community opposition?
Forward this article or tag them in the comments.
The AI industry’s community problem has a natural solution. Let’s build it together.
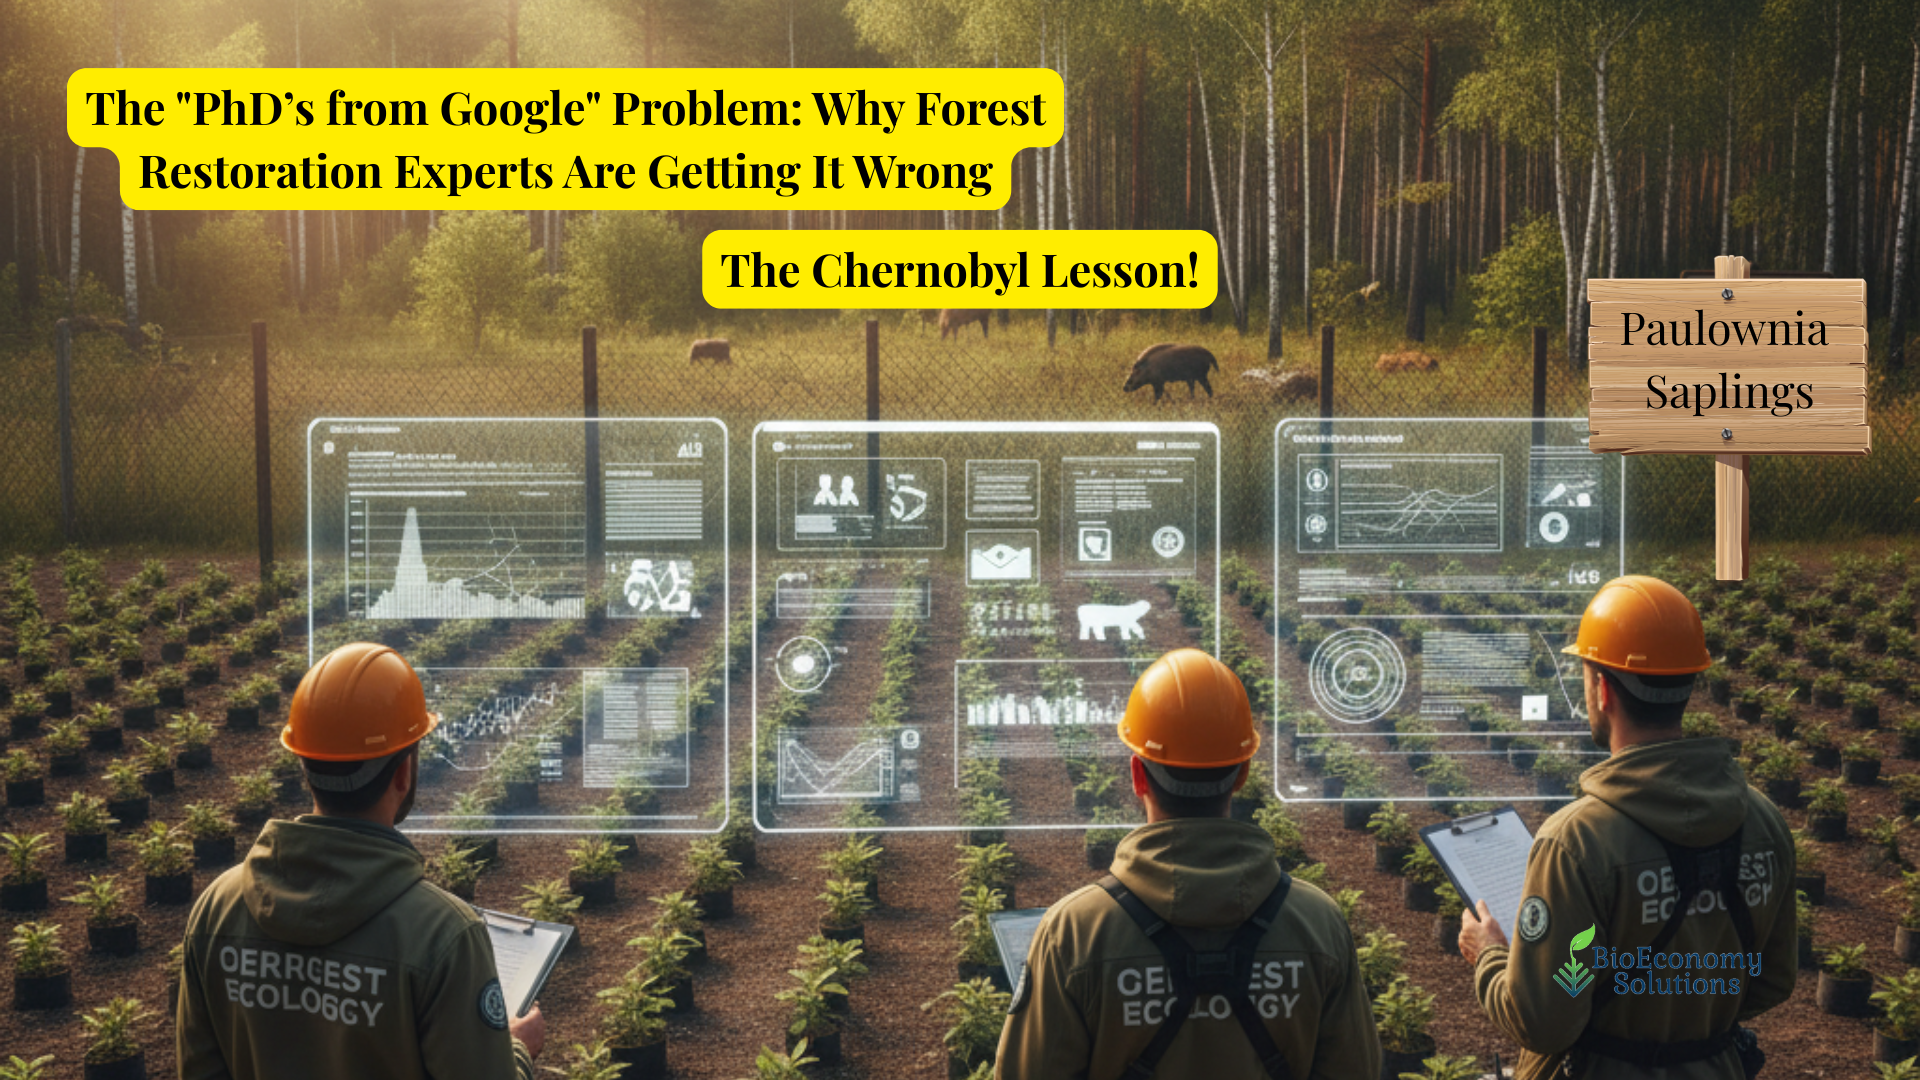
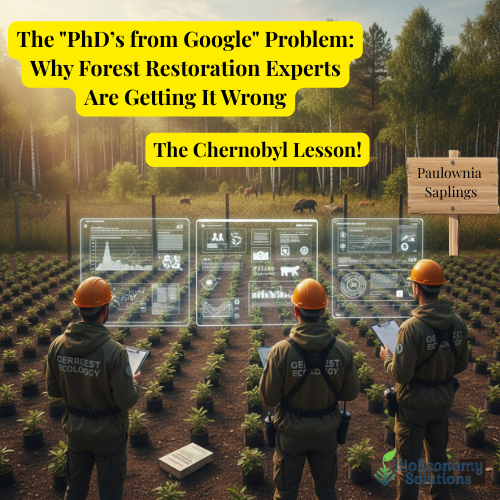
The “PhD from Google” Problem: Why Forest Restoration Experts Are Getting It Wrong (And What Chernobyl Teaches Us)!
They have PhDs in ecology. They study forest restoration for decades.
But they’re missing the biggest lesson hiding in plain sight.
While forest restoration experts debate the evils of “monoculture” tree planting, there’s a radioactive wasteland that became Europe’s most biodiverse ecosystem—without a single PhD managing it.
The lesson from Chernobyl changes everything we think we know about restoration.
The Academic Blind Spot
Walk into any forest restoration conference and you’ll hear the same refrain:
“Tree planting is just monoculture!”
“Single species plantations create green deserts!”
“We need natural diversity, not fast-growing exotics!”
They’re not wrong about the problem.
Most large-scale tree planting does create ecological dead zones:
Single species (pine, eucalyptus) for easy management
No understory diversity
Vulnerable to pests and disease
Poor soil health and nutrient cycling
But they’re missing the solution hiding in their own backyard.
The Chernobyl Revelation
April 26, 1986: Nuclear disaster creates 2,600 km² exclusion zone.
What happened next shocked ecologists:
The most contaminated place on Earth became Europe’s most biodiverse ecosystem.
How is this possible?
The answer reveals everything wrong with modern restoration thinking:
Human Absence > Perfect Management
What Chernobyl eliminated:
Hunting and trapping
Industrial agriculture
Logging and development
Chemical inputs
Intensive land management
The result:
Wolf populations 7x higher than surrounding areas
Brown bears returned after century-long absence
Elk, deer, boar thriving despite radiation
Diverse habitats: forests, meadows, wetlands, abandoned settlements
The brutal truth: Removing human interference worked better than decades of restoration science.
The Rewilding Revolution
Smart farmers are learning from Chernobyl’s accidental lesson.
The new trend: Agricultural rewilding
Instead of fighting nature, they’re stepping back and letting ecological processes lead.
Two Rewilding Models:
Land Sparing:
Convert marginal land entirely to rewilding
Intensify sustainable production on best land
Create wildlife corridors and habitat patches
Land Sharing:
Integrate nature recovery across entire farm
Agroecology, rotational grazing, wide margins
Harmonize food production with biodiversity
The Economic Breakthrough:
Traditional farming: Single revenue stream, high input costs
Rewilding farms: Multiple income sources
Ecotourism and nature experiences
Government environmental payments
Carbon and biodiversity credits
Reduced input costs (fertilizers, pesticides)
Why Forest Experts Miss the Point
The academic trap: Perfect is the enemy of good.
While PhDs debate species composition and natural succession, degraded land sits empty for decades waiting for the “perfect” restoration plan.
Meanwhile, practical solutions exist:
The Guardian Species Approach
Instead of monoculture OR natural diversity, smart restoration uses pioneer species that enable native recovery.
Example: Paulownia as ecosystem catalyst
Fast establishment: Creates habitat structure in 3-5 years vs. decades
Soil improvement: 15-foot taproots break hardpan, increase organic matter 400%
Microclimate creation: Large leaves provide shade, reduce evaporation
Native species enablement: 85% survival rate for native seedlings vs. 30% on bare land
This isn’t monoculture—it’s strategic succession.
The Intercropping Advantage
Academic view: Single species = bad
Reality: Strategic species can support incredible diversity
Paulownia plantations support:
Food crops (soybeans, groundnuts) between rows
Pollinator habitat from flowers
Wildlife corridors and nesting sites
Soil biology restoration
Water retention and erosion control
The Data That Changes Everything
China’s Loess Plateau: World’s largest ecosystem restoration project
35,000 square miles of degraded land restored
Pioneer species approach using fast-growing trees
Result: 2.5 million people lifted from poverty while sequestering massive carbon
Costa Rica’s forest recovery:
Forest cover increased from 24% to 54% in 30 years
Strategy: Fast-growing species + native conservation
Economic model: $500 million forest economy
The pattern: Successful restoration combines speed with diversity, economics with ecology.
What Chernobyl Really Teaches Us
Lesson 1: Absence of harm > presence of perfection
Sometimes the best management is minimal management.
Lesson 2: Nature is more resilient than we think
Even radiation couldn’t stop ecological recovery when human pressure was removed.
Lesson 3: Diversity emerges from opportunity, not planning
Create the right conditions, and biodiversity follows naturally.
Lesson 4: Time scales matter
Chernobyl’s 40-year recovery timeline shows patience pays off—but strategic intervention can accelerate the process.
The New Restoration Paradigm
Old thinking: Plan perfect ecosystem, plant native species, wait decades New thinking: Create conditions for natural recovery, accelerate with strategic species
The Practical Framework: Phase 1: Rapid Establishment (Years 1-3)
Plant fast-growing pioneer species (like Paulownia)
Establish basic habitat structure
Improve soil conditions and microclimate
Phase 2: Diversity Integration (Years 3-7)
Introduce native species in improved conditions
Allow natural colonization from seed sources
Manage for increasing complexity
Phase 3: Ecosystem Maturation (Years 7-20)
Reduce management intervention
Allow natural succession processes
Monitor and adapt as needed
The Economic Engine:
Revenue streams fund restoration:
Timber from pioneer species
Carbon credits from sequestration
Biodiversity credits from habitat creation
Sustainable products from managed harvests
Self-funding restoration: Projects pay for themselves while delivering ecological benefits.
Why This Matters Now The restoration challenge is massive:
2 billion hectares of degraded land globally
Climate targets requiring rapid carbon sequestration
Biodiversity crisis demanding habitat restoration
Economic pressures on rural communities
Traditional approaches are too slow:
Decades for native forest establishment
High failure rates on degraded soils
Limited economic incentives
Academic debates while land stays degraded
The Chernobyl lesson:
Sometimes stepping back and letting nature lead—with strategic assistance—works better than micromanagement.
The Path Forward For restoration practitioners:
Embrace pioneer species that enable native recovery
Design for economic sustainability from day one
Focus on ecosystem function over species purity
Learn from natural succession patterns
For policymakers:
Support restoration approaches that combine speed with diversity
Create economic incentives for ecosystem services
Reduce regulatory barriers to innovative restoration
Fund long-term monitoring and adaptive management
For landowners:
Consider rewilding marginal or degraded land
Explore multiple revenue streams from restoration
Partner with restoration experts and carbon markets
Think in decades, not years
The Bottom Line
The forest restoration debate isn’t really about monoculture vs. diversity.
It’s about perfection vs. progress.
While academics debate ideal species compositions, degraded land sits empty. While experts plan perfect ecosystems, climate change accelerates.
Chernobyl’s accidental lesson: Nature is incredibly resilient when given the chance to recover—even under the worst possible conditions.
The practical solution: Strategic intervention that accelerates natural processes while creating economic incentives for long-term stewardship.
The choice: Wait decades for perfect restoration, or start now with good restoration that improves over time.
Sometimes the best forest management is knowing when to step back and let nature lead.
But first, you have to create the conditions for success.
That’s where strategic species selection, economic sustainability, and long-term thinking converge.
The radioactive wasteland that became a biodiversity hotspot shows us the way.
Ready to rethink restoration? The lessons from Chernobyl, rewilding farms, and successful ecosystem recovery projects point toward a new paradigm: strategic intervention that enables natural recovery while creating economic incentives for long-term success.
The forest restoration revolution isn’t about choosing between human management and natural processes—it’s about finding the sweet spot where both work together.
CONTACT US
Contact BioEconomy Solutions for afforestation, reforestation & carbon portfolio assessment.
Your next audit could be a profit opportunity instead of a compliance expense.
We’re happy to organize a time to speak with you about our paulownia trees and lumber we have for sale. Please book your preferred time to speak directly.
Book a Conversation: Here’s a link to my online calendar/schedule:
We’re happy to organize a time to speak with you about our paulownia trees and lumber we have for sale. Please book your preferred time to speak directly.
The combination of thermal, fire, and acoustic insulation properties makes Paulownia unique among natural materials – offering multiple performance benefits in a single, sustainable, fast-growing resource.
Where To Buy USA Paulownia Lumber?
Need paulownia for your next project?
Where to buy paulownia? We’re harvesting our mature U.S. South Carolina Paulownia Timber and have millions of board foot available. We can mill lumber for your business needs. Contact Us for details. Office: 843.305.4777 | Email: mail@bioeconomysolutions.com Here’s a link to our online calendar, schedule a conference call with us:
You will discover that paulownia wood is the “Light Strong Alternative Wood” used in many processes to obtain many types of products.
Weather you are a hobbyist or full time manufacturing company, paulownia wood grown in South Carolina USA may be a new expression of your talent.
We sell Custom Paulownia boards: rough sawn or planed, we offer various sizes and thicknesses. Our Paulownia boards are processed using sustainable Paulownia hardwood grown right here in South Carolina USA.
Total addressable revenue: $67-92M from European market alone
ESG Integration Multiplier:
Premium pricing for verified ESG impact: +25-40%
Long-term offtake agreements: Reduced market risk
Diversified revenue streams: Timber, carbon, biochar, data
The Regulatory Tailwind
EU Taxonomy Alignment:
Climate change mitigation (carbon sequestration)
Climate change adaptation (soil restoration)
Sustainable use of water and marine resources
Transition to circular economy (waste-to-value)
Pollution prevention and control (soil remediation)
Protection of healthy ecosystems (biodiversity enhancement)
CSRD Reporting Benefits:
Quantifiable environmental impact metrics
Verifiable carbon removal documentation
Supply chain sustainability evidence
Stakeholder engagement proof points
The Bottom Line
The biochar market is exploding, but feedstock supply is the bottleneck.
The ESG market demands verifiable impact, but most solutions lack transparency.
Paulownia solves both problems:
Reliable, scalable biochar feedstock
Integrated ESG impact with audit-grade documentation
Multiple revenue streams reducing investment risk
Regulatory alignment across EU frameworks
While competitors struggle with feedstock shortages and ESG compliance, Paulownia-based solutions capture both the $340M biochar opportunity and the $20B ESG market through integrated, verifiable impact.
The question isn’t whether these markets will grow—it’s whether you’ll be positioned to capture them.
Ready to explore how Paulownia can position your organization in the biochar and ESG growth markets? Contact BioEconomy Solutions to learn how purpose-grown feedstock and integrated ESG solutions create competitive advantages in rapidly expanding markets.
The biochar boom needs feedstock. The ESG market needs proof. Paulownia delivers both.
Contact Us for paulownia saplings and planning assistance.
Where To Buy Paulownia? Paulownia For Sale – QUESTIONS?
We’re happy to organize a time to speak with you about our paulownia trees and lumber we have for sale. Please book your preferred time to speak directly.
The $50 Billion Carbon Credit Rush: Why Smart Money Is Buying Trees (Before It’s Too Late)
The market that’s about to explode from $8 billion to $200 billion in the next 6 years – and 99% of people have no idea it exists.
While everyone’s chasing crypto and AI stocks, the smartest investors are quietly buying something that literally grows money from dirt. And the supply is running out faster than anyone expected.
Here’s exactly what’s happening in the carbon credit market and how you can position yourself before this opportunity disappears forever.
SECTION 1: The Market Explosion Nobody Sees Coming
Right now, only 537 companies globally are buying carbon removal credits. But over 10,000 companies have committed to net-zero targets by 2030.
The Math Is Staggering:
If just 10% start buying, the market needs to scale 25 times overnight
New regulations force companies to buy starting in 2026
Current market: $8 billion → Projected: $200+ billion
The Clear Winner: Biochar dominates everything:
86% of all carbon removal deliveries in 2024
80% of buyers choose biochar over other solutions
Delivers credits in 1-3 years vs. 20+ years for traditional forestry
But here’s the problem that’s about to make early investors very wealthy..
SECTION 2: The Supply Crisis Creating Millionaires
Supply Is Disappearing Before Our Eyes:
62% of high-quality biochar capacity for 2025: SOLD OUT
28% of 2026 supply: LOCKED UP in contracts
Only 30% of biochar projects meet institutional quality standards
Smart Money Strategy: While most people buy carbon credits at market price, companies like Microsoft, Google, and Stripe are signing “offtake agreements” – pre-ordering years in advance at massive discounts.
The Results Speak for Themselves:
15-30% discounts compared to spot prices
One company saved $918,750 on a single 3-year deal
Historical example: $125/tonne (2022 offtake) vs. today’s $165/tonne
SECTION 3: The Price Explosion That’s Already Started
Why Prices Will Skyrocket:
Biochar prices already grew 29.2% annually for 4 consecutive years
By 2030, demand could be 6 times larger than available supply
70% of new biochar capacity fails quality standards
The Perfect Storm Is Brewing:
10,000+ companies must start buying by 2026 (regulatory requirements)
Each biochar facility caps at 100,000 tonnes/year maximum
Less than half of 2030 demand is currently financed
Reality Check: Companies without secured supply contracts risk missing their climate targets entirely due to supply shortages.
SECTION 4: How to Position Yourself in This Rush
Your Investment Options:
1. Direct Offtake Agreements
15-30% discounts vs. spot market
1,000+ ton minimums required
Multi-year contracts lock in favorable pricing
2. Carbon Credit Investment Funds
Lower minimums for smaller investors
Professional management handles sourcing and verification
2026: Regulatory requirements kick in, demand surge begins
2027+: Spot market chaos, premium pricing becomes the norm
The Numbers Don’t Lie: This Is Bigger Than Anyone Realizes
Market Reality Check:
Current CDR capacity: 0.003% of what’s needed by 2050
Demand growth: 78% in 2024 while broader carbon markets contracted 61%
Supply concentration: Only 36% of CDR suppliers have registered any sales
Quality crisis: 70% of expected biochar capacity by 2026 fails standards
What the Smart Money Knows: Microsoft, Google, and Stripe drove 80% of all CDR purchases in 2024. They’re not buying on the spot market—they’re locking up supply years in advance through offtake agreements.
Why This Opportunity Won’t Last
The biochar landgrab is already underway. Here’s what’s happening behind closed doors:
Major corporations are signing exclusive multi-year supply deals
High-quality producers are getting locked up by early movers
Spot market buyers will be left competing for scraps at premium prices
The window to act is measured in months, not years.
Your Next Move
The carbon credit market is moving from speculation to necessity. In 5 years, you’ll either thank yourself for understanding this early, or watch others profit from the biggest commodity rush of our lifetime.
The facts are clear:
Supply is disappearing faster than new capacity comes online
Prices are rising at 29%+ annually with no ceiling in sight
Regulatory requirements will force 10,000+ companies to become buyers
Early movers are securing 15-30% discounts while latecomers pay premiums
This isn’t about saving the planet anymore—it’s about positioning yourself in a supply-constrained market before everyone else figures it out.
Ready to explore your options in the carbon credit rush?
Contact BioEconomySolutions.com and book your private strategy session today. We’ll show you exactly how to position yourself in this market before the opportunity disappears.
The carbon credit landgrab is happening now. The question isn’t whether you’ll participate—it’s whether you’ll be early or late.
Contact Us
BioEconomy Solutions is a Carbon Dioxide Removal (CDR) Project Developer. Talk to us about our TREE PLANTING strategies with Paulownia trees.
We’re happy to organize a time to speak with you about our paulownia trees and lumber we have for sale. Please book your preferred time to speak directly.
Steve Martinez, a Boise contractor, watches lumber prices swing wildly—sometimes increasing tenfold overnight. Canada has historically accounted for a very high percentage of U.S. softwood lumber imports, typically in the 70–85% range. Recent data shows this percentage has shifted. For example, in 2024, Canada accounted for 84.3% of U.S. softwood lumber imports.
The new potential tariffs jumping from 14.5% to 34.5%, America’s construction industry faces an unprecedented crisis which ultimately the end consumer pays the price.
The numbers are staggering: over 100 million American households can’t afford the median $460,000 home price, while builders struggle with fixed contracts and volatile material costs that make up 15-18% of total construction expenses.
But what if there was a domestic solution growing right under our noses?
Enter Paulownia: America’s Untapped Lumber Goldmine
While politicians debate tariffs and regulations, a revolutionary wood species is quietly proving itself across American soil. Paulownia—often called the “aluminum of lumber”—offers properties that could transform the U.S. construction landscape.
The Paulownia Advantage: Superior Performance Metrics
Strength-to-Weight Champion:
30% lighter than traditional hardwoods
Twice as strong as balsa wood
Highest strength-to-weight ratio of any wood globally
Perfect for reducing transportation costs and construction labor
Termite and rot resistant without chemical treatment
Dimensionally stable—resists warping, shrinking, and cracking
Ideal for moisture-prone applications like saunas and pool decks
Construction Versatility:
Non-load-bearing structural components
Interior finishing and trim work
Flooring with superior dimensional stability
Natural insulation properties
Acoustic panels for soundproofing
Paulownia Bearing The Load
Non-load-bearing structural components are elements of a building that do not support the main weight of the structure, such as the roof or floors. Instead, they primarily serve functions like dividing spaces, providing insulation or soundproofing, or acting as decorative finishes. Examples include interior partition walls, drywall, and exterior cladding.
Paulownia Wood and Load-Bearing Applications
Paulownia wood is exceptionally lightweight, often compared to balsa wood, but it has a high strength-to-weight ratio. While it is naturally a non-load-bearing material by itself, its properties can be enhanced through existing engineered wood technologies to make it suitable for some load-bearing applications.
These technologies generally involve processing the wood to create composite materials with improved structural properties:
Laminated Veneer Lumber (LVL): This process involves bonding thin layers (veneers) of wood together with adhesives. By arranging the grain of all veneers parallel to the long direction, LVL creates a strong, stiff, and dimensionally stable product.
Sandwich Panels: Paulownia wood can be used as the lightweight core material in a sandwich panel, with stronger, denser materials like fiberglass, plywood, or other hardwoods bonded to its surfaces. This structure provides high stiffness and strength while keeping the overall product lightweight.
Glued Laminated Timber (Glulam): Similar to LVL, glulam is made by bonding together smaller pieces of wood into larger, more stable members. This process can utilize the lightweight properties of paulownia for the core while potentially using stronger wood or other materials for the outer laminations to increase its load-bearing capacity.
The use of these engineered wood products allows paulownia to be utilized in structural applications where its natural properties alone would be insufficient, leveraging its fast growth and sustainable characteristics for a greener building industry.
Engineered wood technologies, including laminated veneer lumber (LVL) and cross-laminated timber (CLT), are used in modern construction.
How Strong Is Paulownia Wood?
Solving America’s Lumber Supply Chain Crisis
Speed to Market: The Game-Changer
While traditional softwood takes 20-50 years to mature, Paulownia delivers:
Harvestable timber in 5-7 years
15-30 feet of growth in first season
Coppicing ability: Regrows from cut stumps without replanting
Multiple harvests from single planting
This means American landowners could establish domestic lumber supply chains in less than a decade—not the generations required for traditional forestry.
Geographic Flexibility
Unlike softwood forests concentrated in the Pacific Northwest and Southeast, Paulownia thrives across diverse American landscapes:
Semi-arid regions previously unsuitable for timber
Degraded agricultural land generating new rural income
Marginal soils where food crops struggle
Urban periphery for distributed lumber production
USA Paulownia Lumber now has “Class A” ASTM E84 Flame Spread Rating.
A Class A ASTM E84 flame spread rating for Paulownia lumber is highly significant for its advancement in the U.S. structural lumber and interior building materials market. Here’s why:
Economic Impact: Beyond Lumber
For Rural America:
Farmers diversify income with fast-growing timber crops
Abandoned farmland becomes productive again
Local sawmills process regional Paulownia supply
Carbon credit revenue provides additional income streams
For Builders:
Reduced transportation costs from distributed production
Price stability through domestic supply chains
Superior performance characteristics reduce callbacks
Lightweight properties decrease labor costs
For Homeowners:
Lower construction costs through domestic supply
Superior insulation reduces energy bills
Fire-resistant properties may lower insurance premiums
Sustainable building materials increase property values
The Construction Applications Revolution
Mass Timber Potential
While Paulownia isn’t suitable for primary load-bearing applications, its unique properties make it ideal for paulownia mass timber applications:
Sandwich Construction:
Paulownia core with hardwood exterior
Maintains strength while reducing weight
Significant material cost savings
Enhanced insulation properties
Engineered Wood Products:
Laminated veneer lumber (LVL) applications
Cross-laminated timber (CLT) components
Glue-laminated beams for specific applications
Specialty Markets
High-Value Applications:
Musical instrument construction (proven market)
Boat building and marine applications
RV and mobile home construction
Modular housing components
Addressing the Labor Crisis
The U.S. lumber industry faces severe labor shortages, with employment expected to decline 2-4% by 2033. Paulownia offers solutions:
Mechanized Harvesting:
Forage harvesters process 80-100 green tons per hour
Reduced dependence on skilled logging crews
Safer harvesting operations
Lower labor costs per board foot
Distributed Processing:
Smaller, regional mills reduce transportation
Less specialized labor required
Community-based economic development
Reduced infrastructure investment
The Regulatory Advantage
While traditional forestry battles the Endangered Species Act and National Environmental Policy Act, Paulownia offers regulatory benefits:
Environmental Positives:
Carbon sequestration during growth phase
Soil improvement on degraded lands
No impact on old-growth forests
Biodiversity enhancement when properly managed
Fast Permitting:
Agricultural land conversion simpler than forest management
Market Opportunity: With lumber representing a $60+ billion annual U.S. market, even capturing 10% would create a $6 billion Paulownia industry—enough to meaningfully impact supply and pricing.
Implementation Strategy: A Roadmap Forward
Phase 1: Pilot Projects (Years 1-3)
Establish demonstration plantations in key regions
Partner with progressive builders for testing
Develop processing and grading standards
Create supply chain partnerships
Phase 2: Scale-Up (Years 3-7)
Expand acreage based on proven demand
Build regional processing facilities
Establish distribution networks
Develop specialized applications
Phase 3: Market Integration (Years 7-15)
Achieve meaningful market share in specialty applications
Integrate with existing lumber supply chains
Export surplus production
Establish Paulownia as standard construction material
The Investment Opportunity
For Landowners:
Convert marginal land to productive timber assets
Generate income while trees mature through carbon credits
Benefit from multiple harvest cycles
Participate in growing domestic lumber market
For Investors:
Early entry into emerging domestic lumber supply
ESG-compliant investment with measurable impact
Multiple exit strategies through various end markets
Hedge against lumber price volatility
For Communities:
Rural economic development opportunities
Reduced dependence on volatile agricultural markets
Local processing jobs
Sustainable economic base
Overcoming the Challenges
Market Acceptance:
Education about Paulownia’s superior properties
Demonstration projects proving performance
Building code acceptance and standards development
Architect and engineer training programs
Supply Chain Development:
Processing equipment adaptation
Quality grading systems
Distribution network establishment
End-user education and support
Scale Requirements:
Coordinated planting across multiple landowners
Processing facility investment
Market development initiatives
Policy support for domestic alternatives
The Climate Bonus
While solving America’s lumber crisis, Paulownia delivers massive climate benefits:
80-100 tons CO₂ sequestered per acre in first 5 years
Carbon-negative construction materials
Reduced transportation emissions from domestic supply
Soil improvement on degraded lands
This creates additional revenue through carbon credit markets while addressing climate goals.
The Time Is Now
America’s lumber crisis demands innovative solutions. While politicians debate tariffs and regulations, Paulownia offers a market-based path forward:
✅ Domestic supply security
✅ Superior performance characteristics
✅ Rapid deployment timeline
✅ Rural economic development
✅ Climate benefits
✅ Regulatory advantages
The question isn’t whether Paulownia can help solve America’s lumber crisis—it’s whether we’ll act fast enough to capture the opportunity.
Every month we delay is another month of volatile prices, housing unaffordability, and missed economic development.
The solution is growing. Literally.
Ready to explore Paulownia opportunities for your land, business, or investment portfolio? The domestic lumber revolution starts with the first tree planted.
Contact us to learn how Paulownia can transform your piece of America’s lumber future.
Conclusion
The Paulownia tree, with its FAST growth rate, carbon capture abilities, and adaptability, is a powerful tool in climate change mitigation, biodiversity support, and sustainable forest management. When used appropriately in afforestation and reforestation projects, it holds the potential to restore ecosystems, combat deforestation, and provide long-term environmental and economic benefits.
Contact Us
BioEconomy Solutions is a Carbon Dioxide Removal (CDR) Project Developer. Talk to us about our TREE PLANTING strategies with Paulownia trees.
We’re happy to organize a time to speak with you about our paulownia trees and lumber we have for sale. Please book your preferred time to speak directly.