The biggest wealth transfer in modern industrial history is happening right now. Here’s what the data says — and what it means for where capital should be moving.
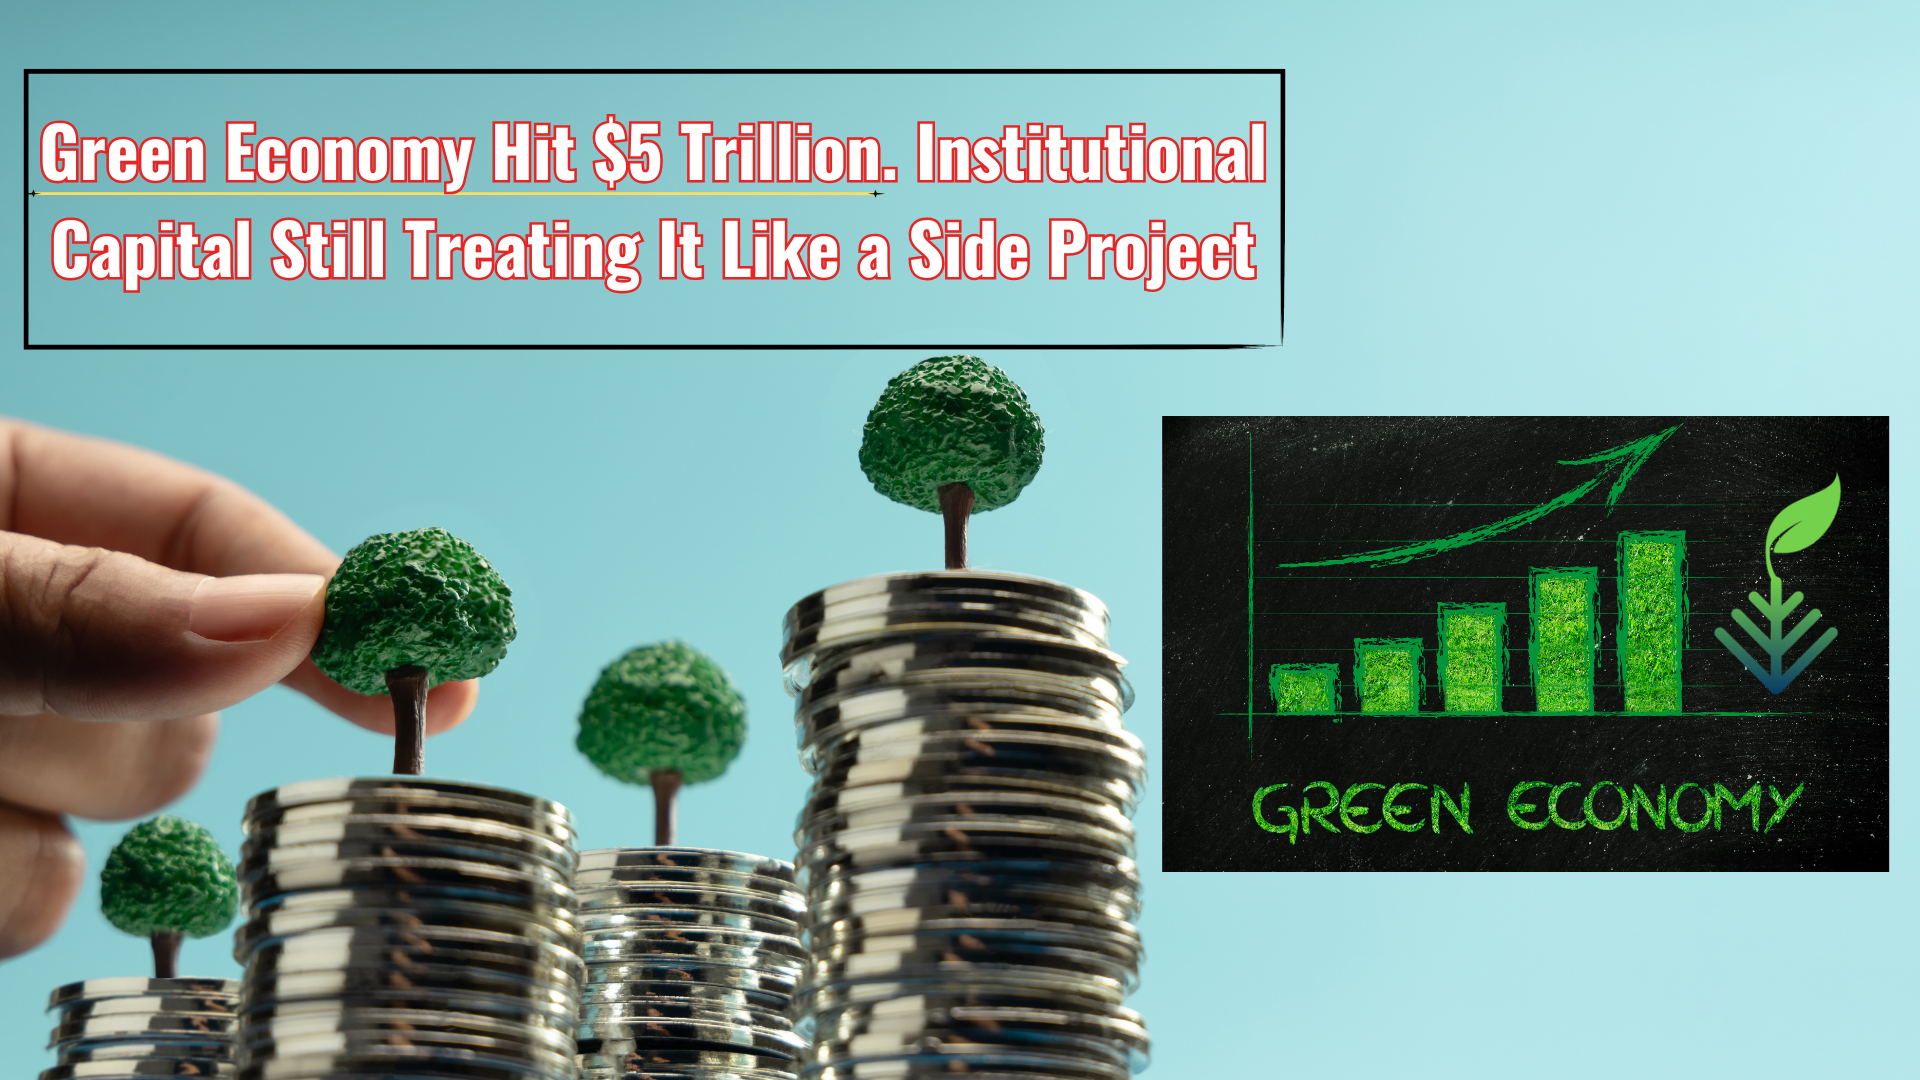
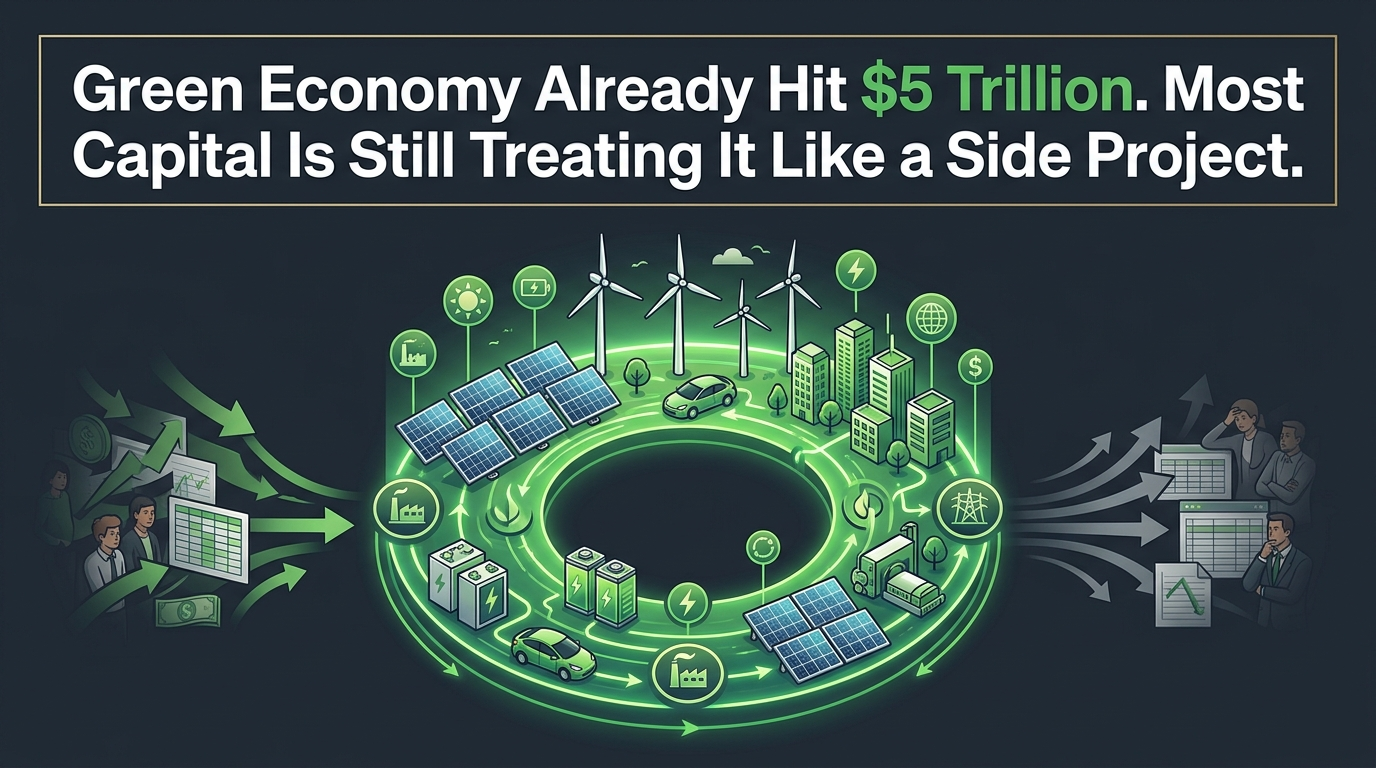
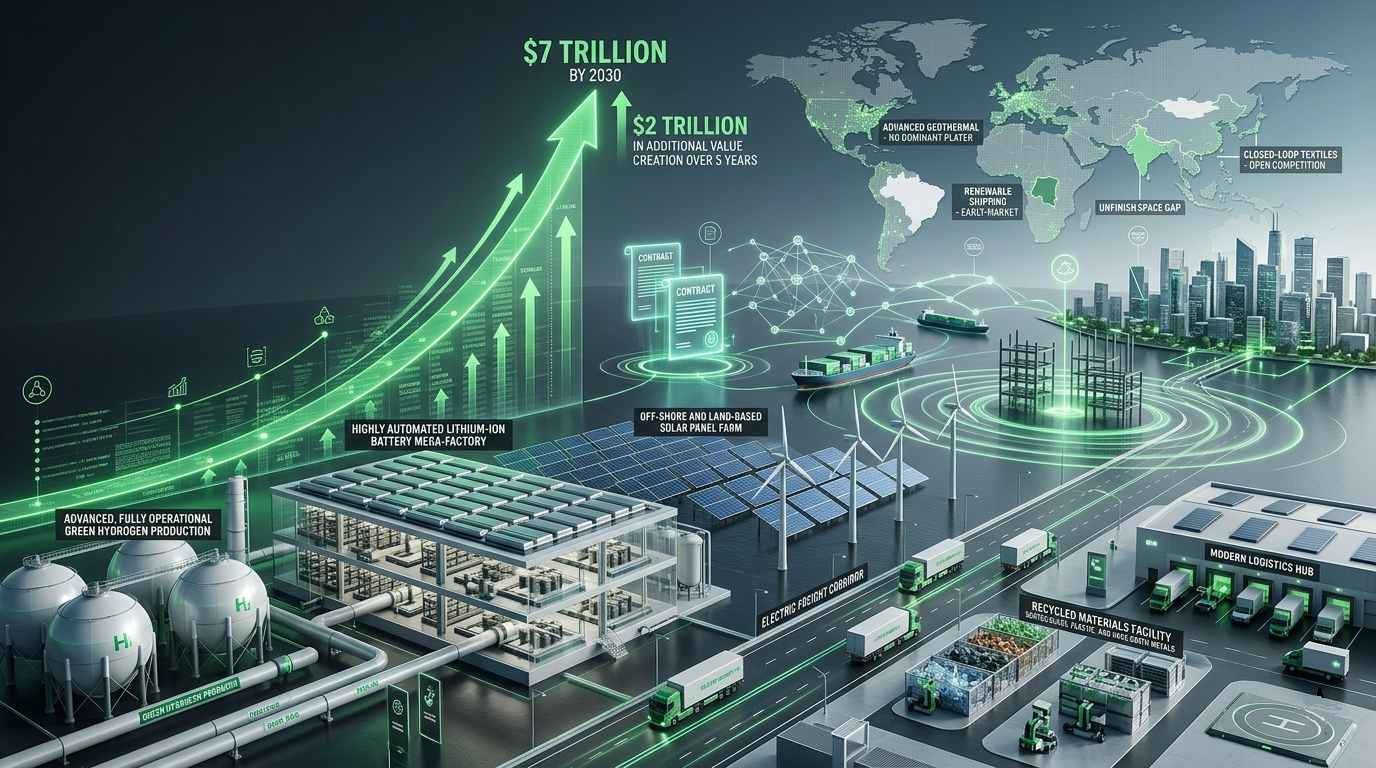
So the data confirms it! The World Economic Forum (WEF), in collaboration with BCG, confirmed in late 2025 that the global green economy surpassed $5 trillion in annual value, with projections to exceed $7 trillion by 2030.
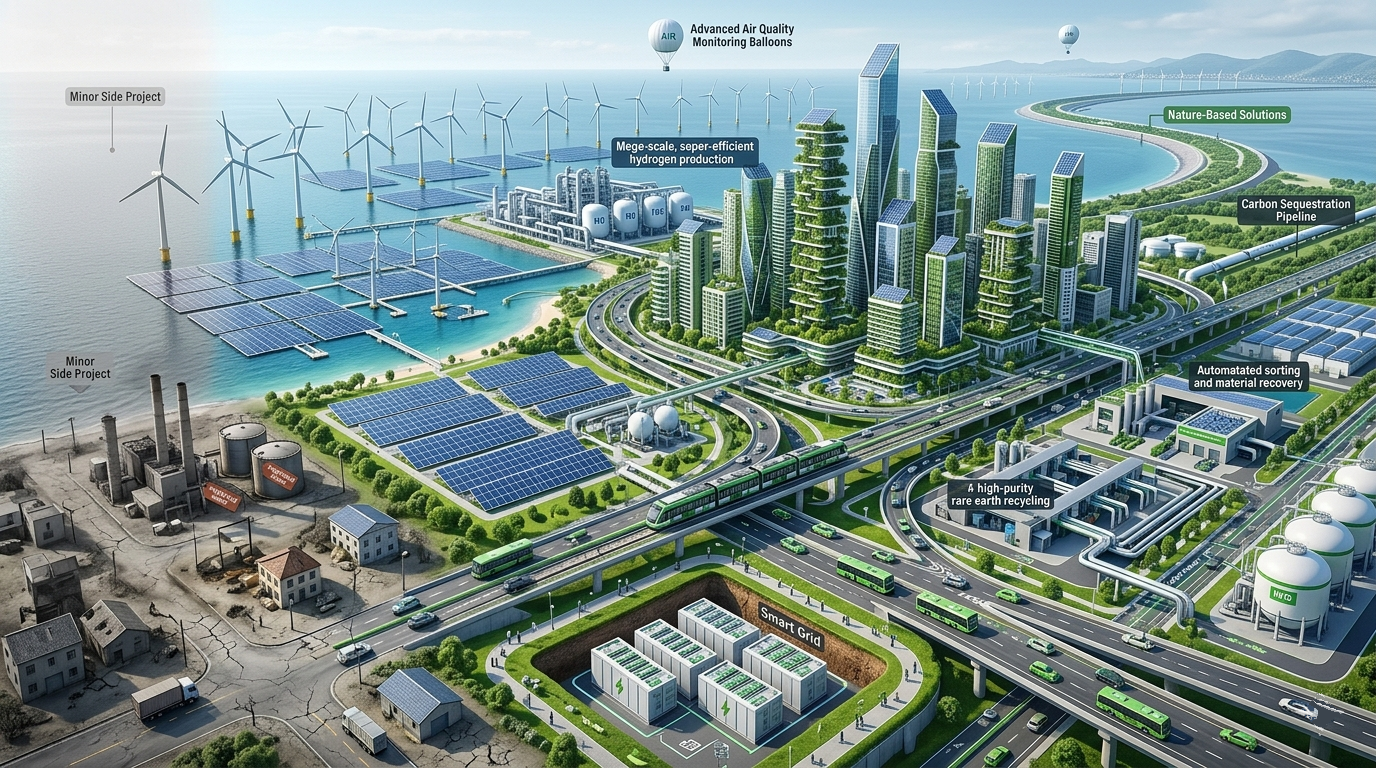
So The Green Economy Hit $5 Trillion. Most People Are Still Treating It Like a Side Project, why is that?
Let’s start with a number that should stop you mid-scroll.
$5 trillion. 💲💲💲💲💲⬅️
That is the current annual value of the global green economy as of 2025. Not projected. Not aspirational. Not a climate activist’s wish list. Current. Verified. And growing at twice the rate of conventional business revenues.
The World Economic Forum (WEF), in collaboration with BCG, confirmed in late 2025 that the global green economy surpassed $5 trillion in annual value, with projections to exceed $7 trillion by 2030.
Growing twice as fast as traditional industries, this sector is now the second-fastest growing area after:
- Technology
- Green Economy
The green economy is now the second-fastest growing market on the planet — behind only the technology sector. It is outpacing traditional industry driven by energy and transport. It is attracting premium capital. And it is reshaping global trade in ways that most operators, investors, and business leaders are still not fully pricing into their decisions.
This is not an environmental story. This is an economic story. And if you’re not reading it as one, you’re already behind.
What $5 Trillion Actually Means
Numbers at this scale are easy to dismiss. They feel abstract. So let’s make it concrete.
The global green economy generating $5 trillion annually means it is larger than the entire GDP of Japan — the third-largest economy in the world. It means it is larger than the combined GDP of every country in Africa. It means that the companies, operators, and capital allocators who have positioned themselves inside this market are not operating in a niche. They are operating in a core industrial sector creating infrastructure to support its growth.
And here is the part that matters most for anyone thinking about where to deploy capital or build a business over the next five years:
Green revenues are currently expanding at twice the rate of conventional business revenues.
That is not a marginal advantage. That is a structural one. When a sector grows at double the rate of the broader economy, compounded over five years, the gap between those who are positioned inside it and those who are not becomes very difficult to close.
The projection to $7 trillion by 2030 represents $2 trillion in additional value creation over five years. That is $2 trillion in new contracts, new supply chains, new infrastructure, new materials markets, and new business models — most of which do not yet have dominant players.
The window is open. But windows close.
Why This Is Happening Now — The Three Pillars Driving the Surge
Understanding why the green economy has reached this scale is not just academic. It tells you where the durable value is — and where the speculative froth is.
Global industry leaders have identified three operational pillars driving the surge to $5 trillion. Each one has direct implications for where capital should be positioned.
Pillar 1: Technology Maturity
The first wave of the green economy was built on promises. Solar would get cheap. Wind would scale. Electric vehicles would become mainstream. Battery storage would solve the intermittency problem.
Those promises have been kept. The technologies matured. The levelized costs came down. And what was once a subsidized experiment is now a cost-competitive industrial reality.
But here is what most people miss about technology maturity cycles: the biggest returns don’t come from the technology itself. They come from the:
- Infrastructure
- Materials
- Supply chains
that the technology requires at scale.
When solar manufacturing scaled, the demand for industrial-grade silicon, aluminum framing, and specialized coatings scales with it. When electric vehicle production scales, the demand for battery-grade lithium, cobalt, and manganese scales with it. When green construction scales, the demand for certified sustainable building materials scales with it.
The technology is the headline. The supply chain is where the money is made.
The implication: The most durable positions in the green economy right now are not in the technologies themselves — they are in the certified, industrial-grade inputs those technologies require to operate at scale.
Pillar 2: Regulatory Navigation
The second pillar is the one that separates operators who understand this market from those who are still treating it as optional.
The regulatory environment around green economy participation is not softening. It is accelerating.
The Inflation Reduction Act in the United States has deployed hundreds of billions of dollars in subsidies, tax credits, and incentives tied to domestic green manufacturing and clean energy deployment. The Green Deal Industrial Plan in Europe is doing the same across the EU. International climate disclosure frameworks — including mandatory Scope 3 emissions reporting — are moving from voluntary to required in jurisdiction after jurisdiction.
What this means in practice: companies that cannot document the sustainability credentials of their supply chains are going to face increasing friction in accessing capital, winning contracts, and operating in regulated markets. Companies that can document those credentials — with certified, verifiable data — are going to command a premium.
This is not a compliance cost. It is a competitive advantage. And the organizations that understand the difference are the ones building positions right now.
The implication: Regulatory alignment is not a legal department problem. It is a strategy problem. The companies that build regulatory navigation into their core operating model — rather than treating it as a cost center — are going to have structurally lower costs of capital and structurally higher valuations than their peers.
Pillar 3: Industrial Feedstocks
This is the pillar that is least understood — and where some of the most significant near-term opportunity exists.
As the green economy has scaled from theoretical models to practical industrial applications, the demand for certified, industrial-grade sustainable inputs has become a critical bottleneck.
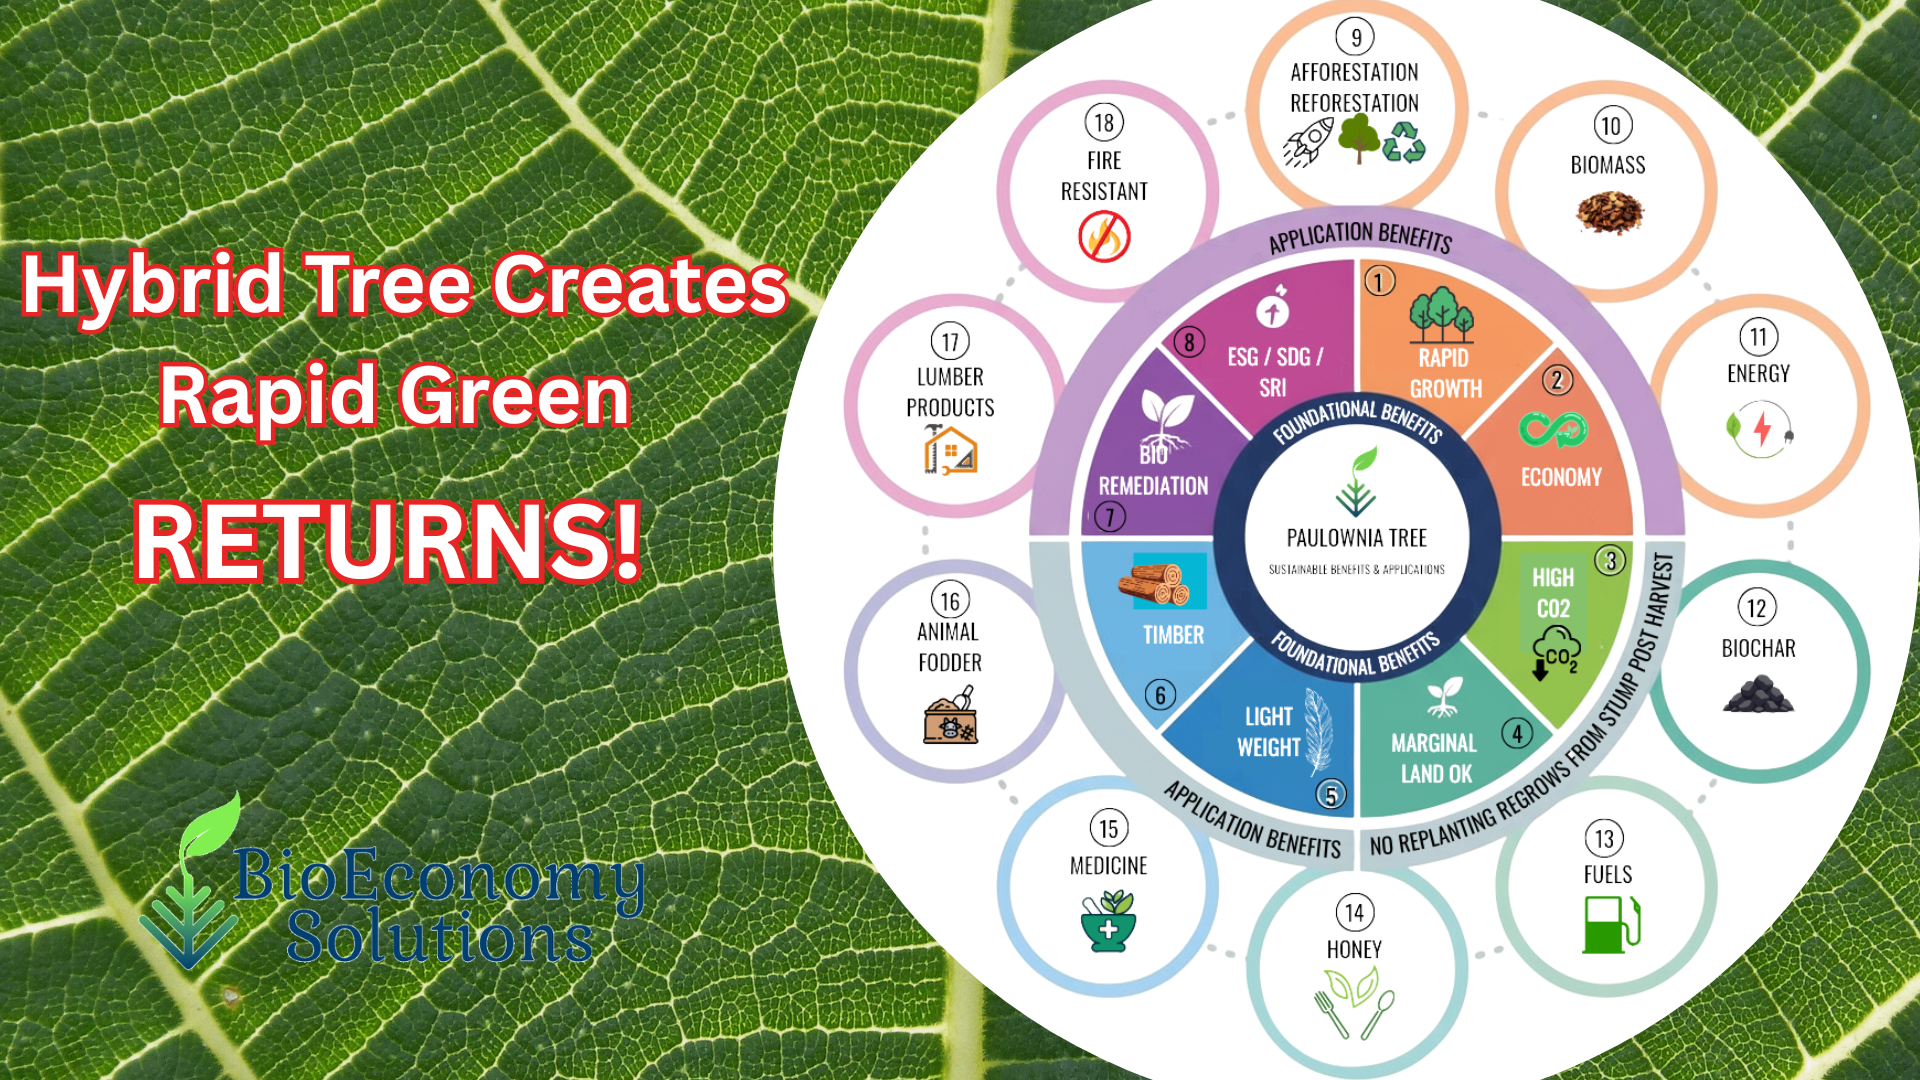
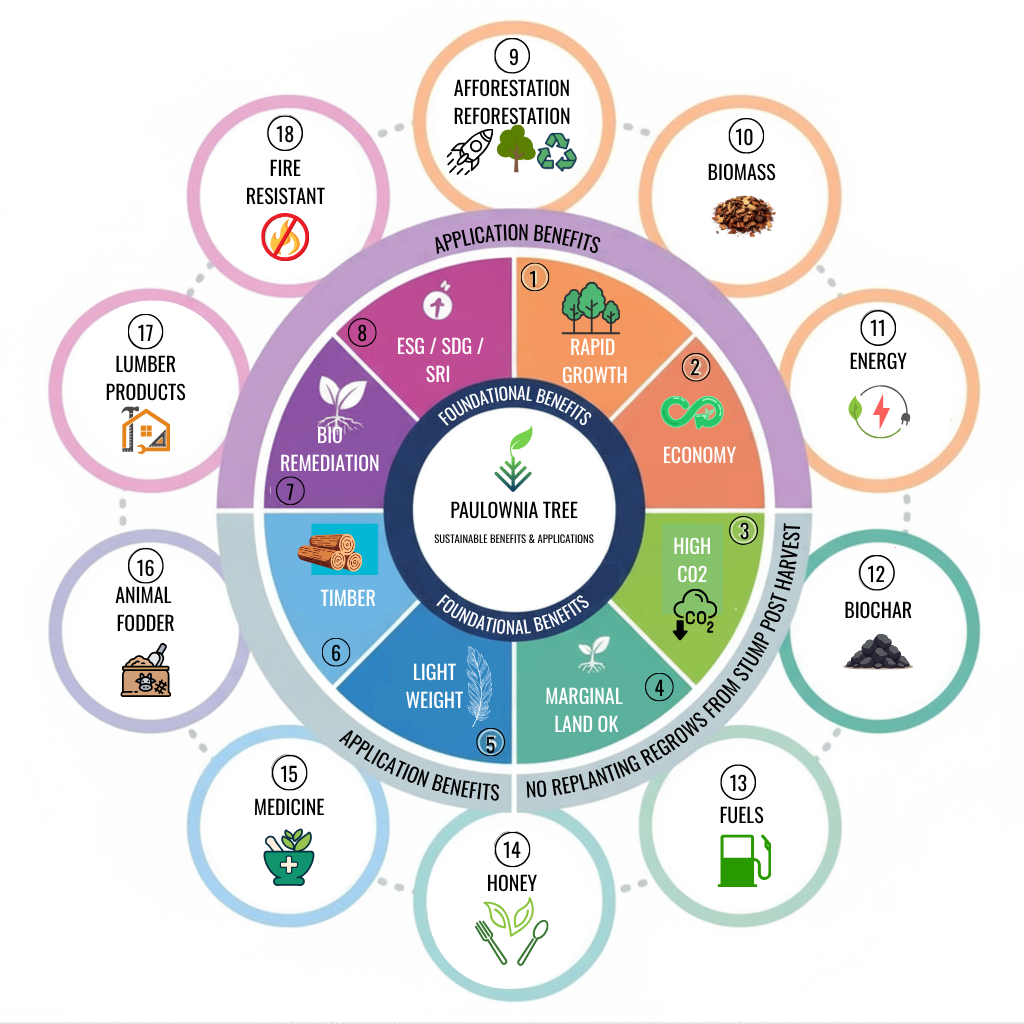
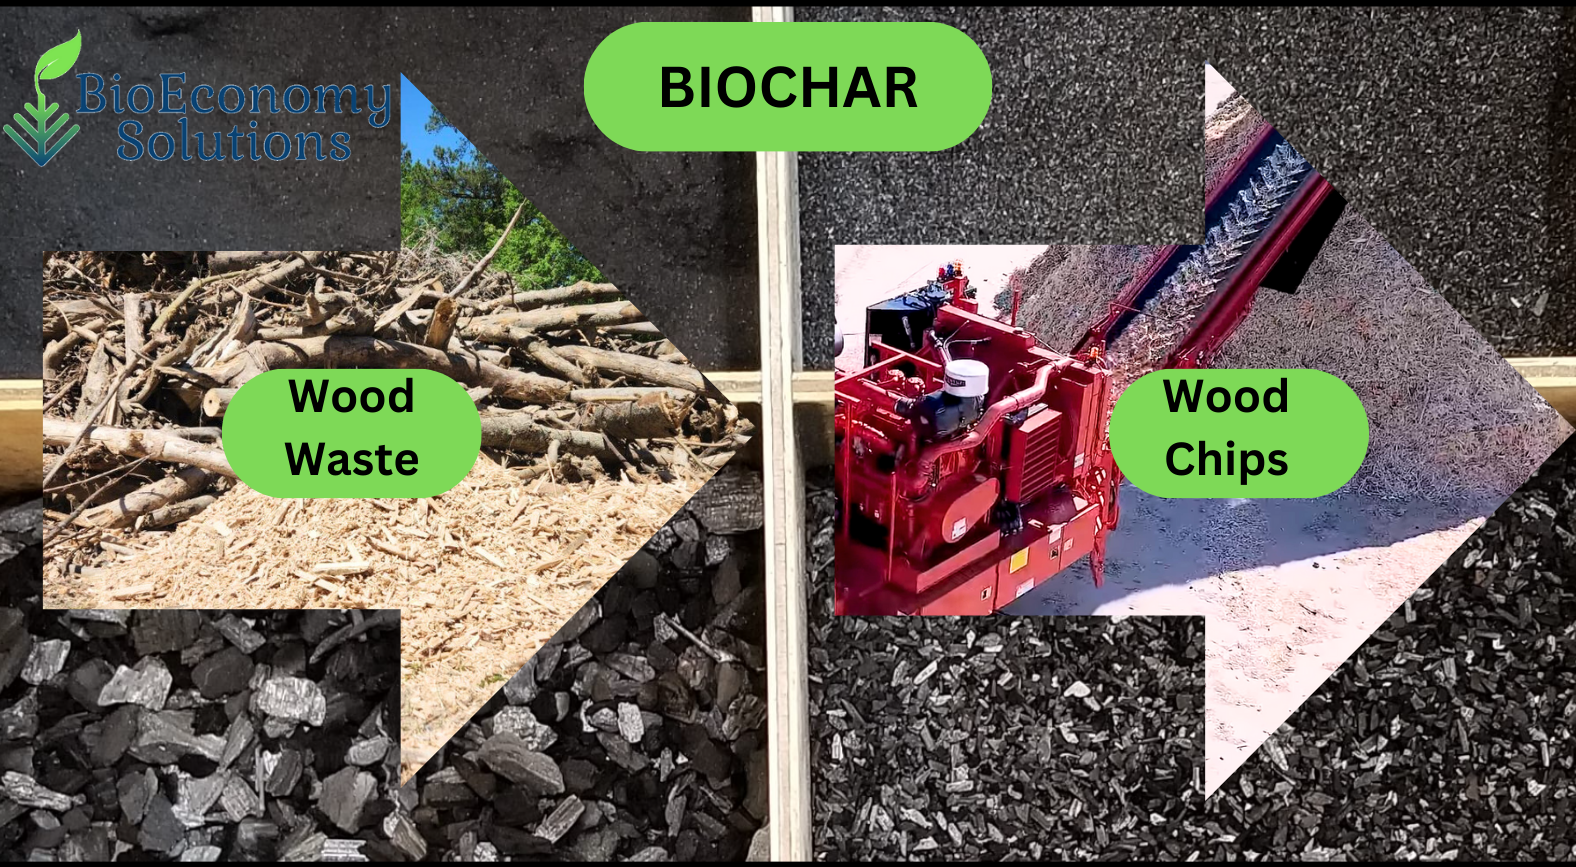
The technologies exist. The regulatory frameworks exist. The capital exists. What is increasingly scarce is the high-quality, verifiable, sustainable raw material that large-scale green manufacturing requires. This is where BioEconomy Solutions exist.
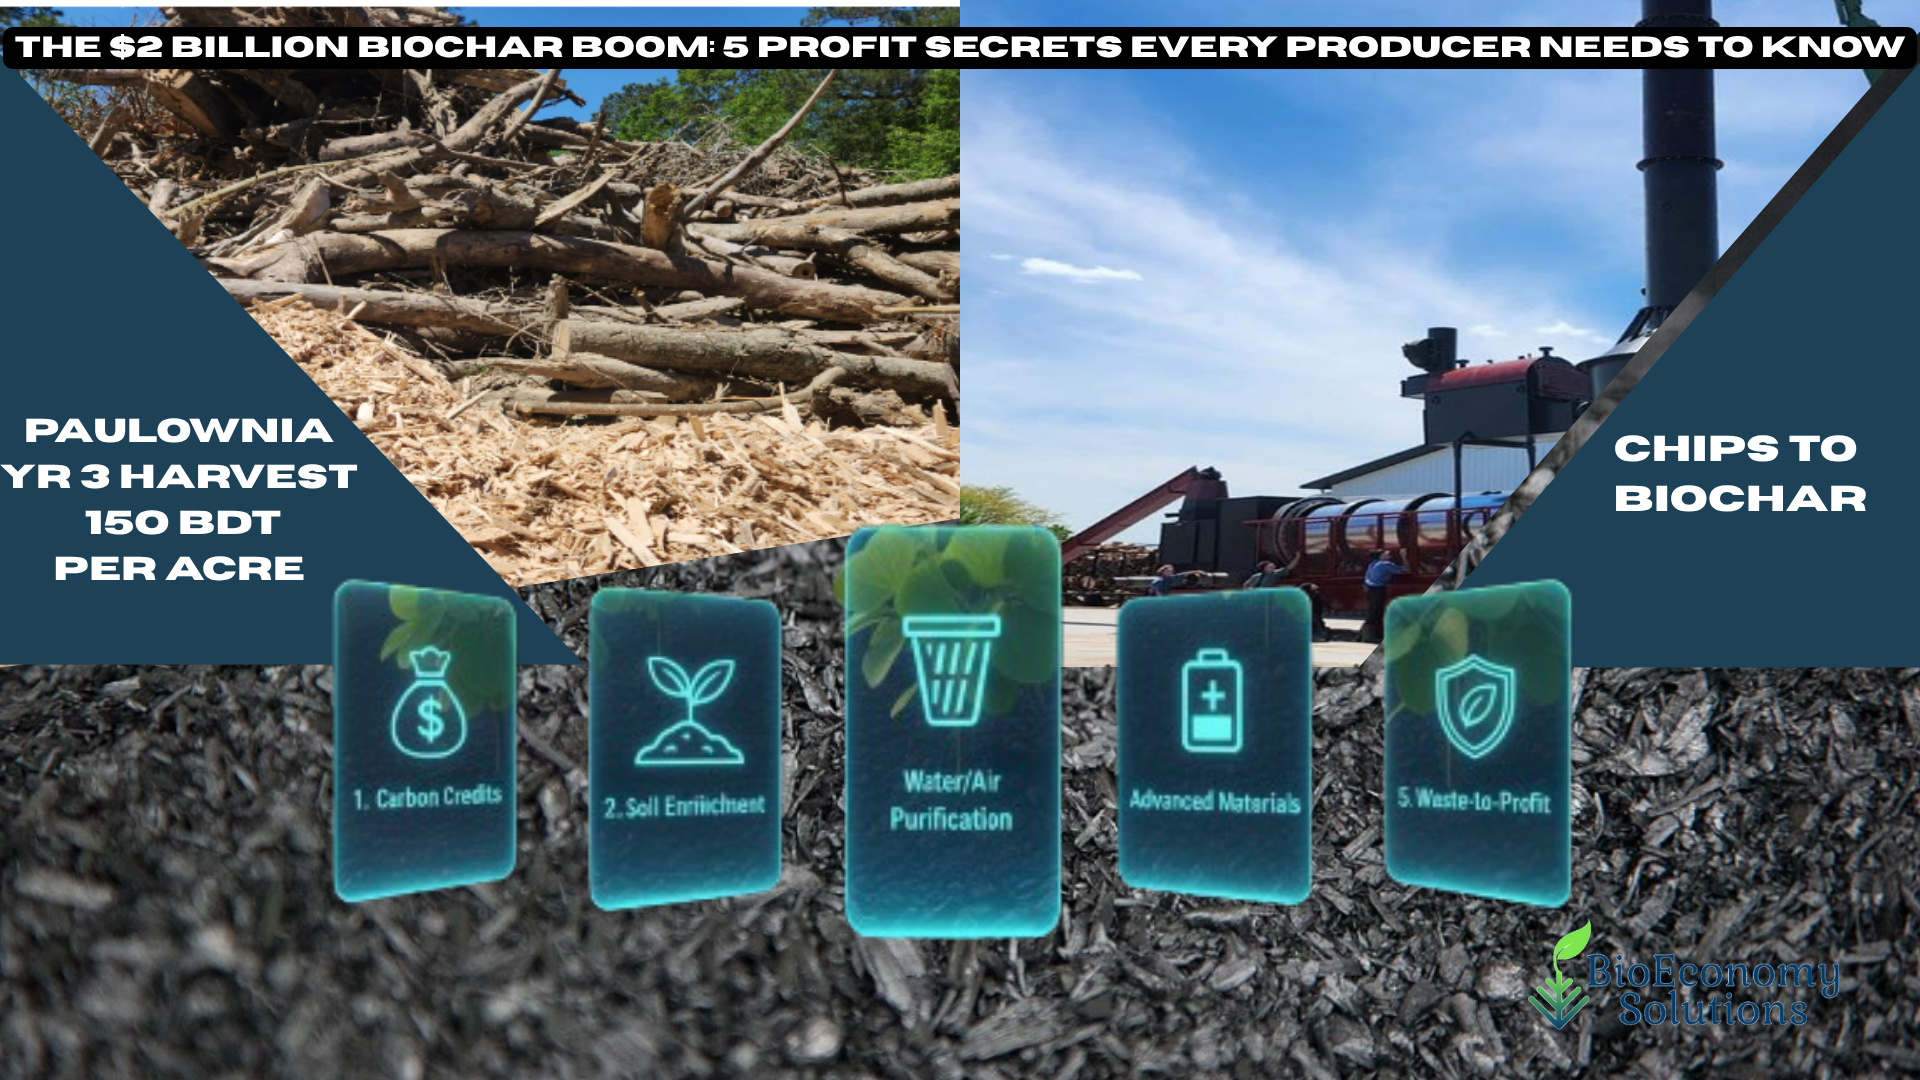
The report is specific about this: high-yield biomass and bio-based materials are transitioning from specialized applications into essential industrial feedstock supply chains. High-density cultivation models producing over 100 to 150 bone dry tons per acre within two to three years are no longer forestry projects. They are industrial supply chain assets.
The language in the report is precise and worth noting: these inputs are becoming essential for meeting the “gold standard” requirements of large-scale green manufacturing.
That language tells you everything about where the pricing power is going to sit in this market over the next five years.
The implication: The scarcest and most valuable resource in the green economy over the next five years is not capital. It is not technology. It is certified, high-quality, industrial-grade sustainable feedstock. The operators who control that supply — with verified credentials, documented yield data, and established supply chain relationships — are going to be in an extraordinarily strong negotiating position.
The Shift That Changes Everything: From Commitments to Execution
Here is the single most important strategic insight in the entire report — and it is stated plainly enough that it is easy to read past it without fully absorbing it.
The market is shifting its focus from “climate commitments” to “operational execution.”
Read that again.
For the past decade, the green economy has been largely driven by commitments. Net zero pledges. Carbon neutrality targets. ESG frameworks. Sustainability reports. The language of intention.
That era is ending.
On page 8 of the report reads:
Growth follows public and private momentum in climate action and adaptation over the last decade The sector’s expansion reflects a sustained momentum in climate action in both national and private spheres.
Today, 142 countries, covering more than 76% of global emissions, have a net-zero commitment in place – up from virtually zero in 2016. Many have implemented regulatory frameworks with increasingly strict emissions standards or have pushed the expansion of low-carbon technologies. Over the same period, corporate decarbonization target-setting has grown exponentially.
By mid-2025, the number of companies with science-based emission reduction targets, or a commitment to set such a target, had surged to 10,949 from just 116 in 2015.9 These companies now represent more than 40% of global market capitalization and approximately 25% of global revenue.
The $2 trillion in additional value projected between now and 2030 is not going to be captured by organizations that make better commitments. It is going to be captured by organizations that execute. That build. That deliver verifiable, measurable, documented results.
This shift has profound implications for every participant in the market — from large corporations to small operators to capital allocators.
For corporations: The ESG report is no longer sufficient. Investors, regulators, and counterparties are demanding operational proof. Supply chain documentation. Verified emissions data. Certified material sourcing. The organizations that can provide that documentation are going to access capital at lower cost and win contracts that their competitors cannot.
For operators and suppliers: The premium is moving to certification and verification. A sustainable material without documentation is worth market price. The same material with certified, verifiable credentials — traceable origin, documented yield, third-party verified sustainability metrics — commands a significant market premium. The report is explicit: certified industrial-grade sustainable materials will command a significant market premium as Scope 3 reporting becomes mandatory.
For capital allocators: The deals worth doing in this market are not the ones with the best climate story. They are the ones with the best operational infrastructure. Verified feedstock supply. Documented performance data. Regulatory alignment. Scalable execution capacity. The capital that flows to those deals is going to generate returns that the commitment-era investments cannot match.
BioEconomy Solutions has produced a standalone platform that offers The ESG Market! (3 T’s) Traceability, Transparency and Trust. Using real-time telemetry and real-time-data.
Where the $2 Trillion Is Going — Sector by Sector
The report identifies specific areas where the expansion from $5 trillion to $7 trillion is expected to concentrate. Understanding the distribution matters for positioning.
Energy and Transport
These remain the largest segments of the green economy and will continue to attract the largest absolute capital flows. But the growth story in energy and transport is increasingly about infrastructure and supply chain rather than technology. The technologies are proven. The bottleneck is execution — grid infrastructure, charging networks, manufacturing capacity, and the certified materials those systems require.
Green Construction
This is an emerging growth area that is significantly underappreciated in most market analyses. As building codes tighten, as embodied carbon becomes a regulated metric, and as green building certifications move from premium to standard, the demand for certified sustainable construction materials is going to accelerate sharply. This is a market that is large, fragmented, and in the early stages of consolidation around quality and certification standards.
Circular Waste Management
The transition from linear to circular material flows is creating new business models across virtually every industrial sector. The value in this space is in the infrastructure — collection systems, processing capacity, certified recycled material supply chains — not in the concept.
Regenerative Agriculture
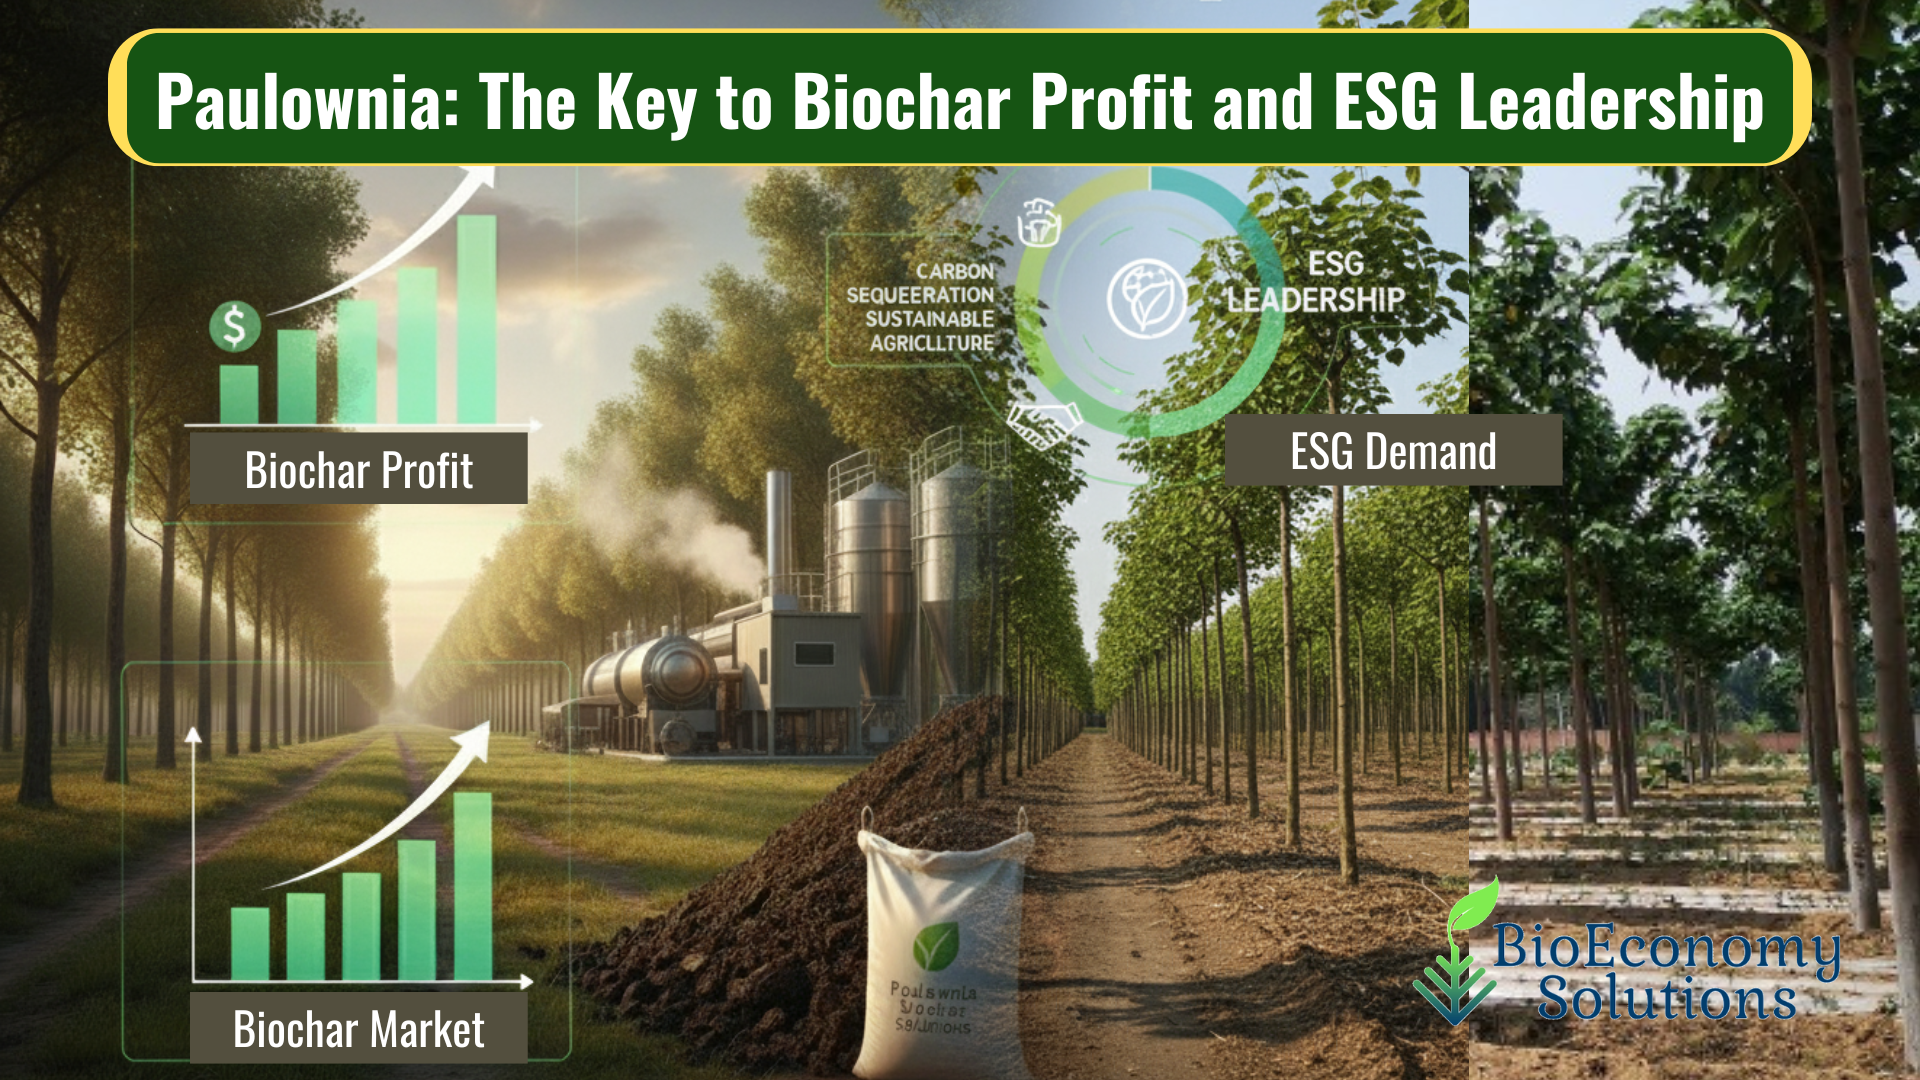
This is the sector with perhaps the longest runway and the most significant near-term supply-demand imbalance. As Scope 3 emissions reporting becomes mandatory, the demand for verified carbon sequestration, certified sustainable agricultural inputs, and documented regenerative practices is going to exceed supply for the foreseeable future. The operators who are building verified, scalable regenerative agriculture systems right now are building assets that are going to be extraordinarily valuable in a mandatory reporting environment.
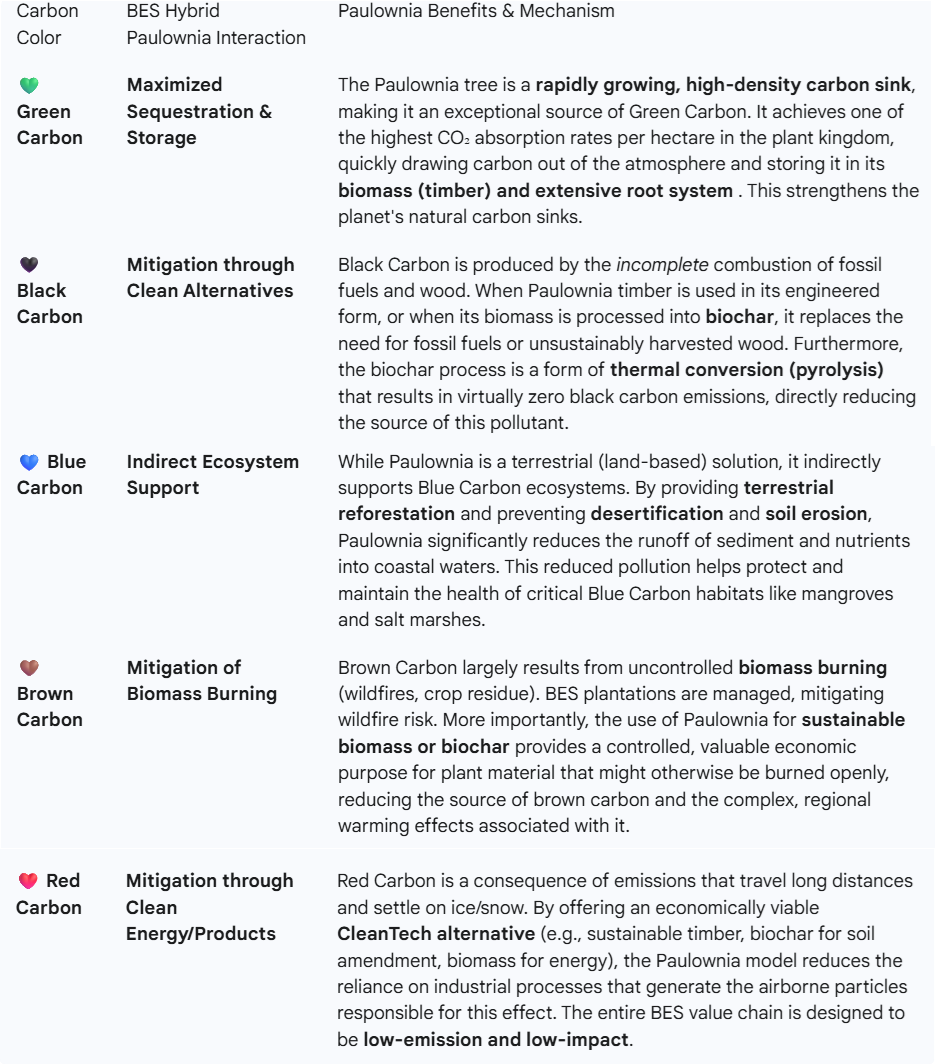
Biomass and Carbon Sequestration
The report is specific and worth quoting directly: “There is an increasing demand for verifiable, high-efficiency biological sources.”
Verifiable. High-efficiency. Biological.
Those three words define the quality standard that the market is moving toward. Not biomass. Verifiable biomass. Not carbon sequestration. High-efficiency carbon sequestration. The premium is in the verification and the efficiency — not just the existence of the resource.
High-density cultivation models producing 100 to 150 bone dry tons per acre within two to three years are explicitly identified as transitioning from specialized forestry into essential industrial feedstock supply chains. That transition is happening now. The supply chain infrastructure to support it is being built now. The operators who are positioned inside that transition — with verified yield data, certified sustainable practices, and established offtake relationships — are building positions that are going to be very difficult to replicate in three to five years.
BioEconomy Solutions provides traceability and feedstock security to all of these sectors.
The Capital Advantage Nobody Is Talking About Loudly Enough
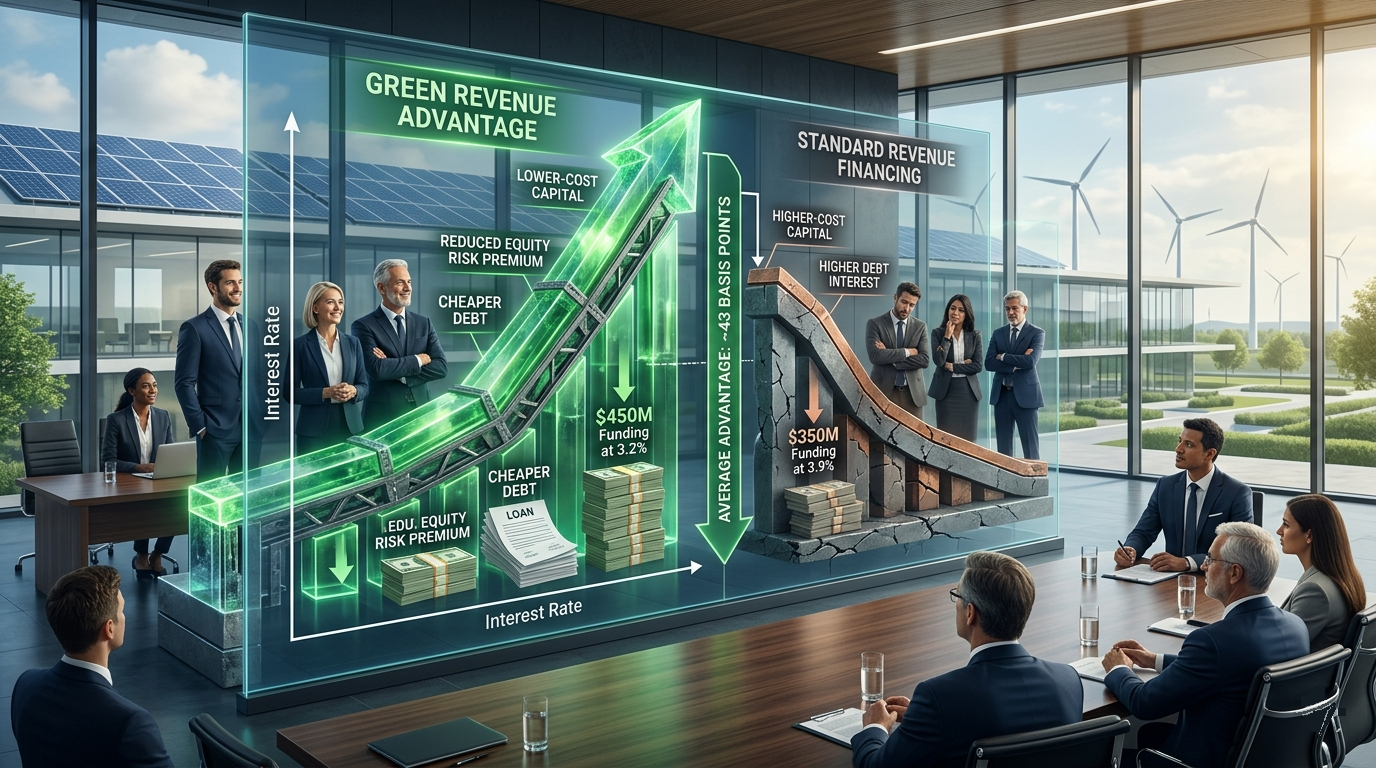
The Lower Cost Capital Advantage
- Capital Advantage: Companies operating within the green sector are increasingly benefiting from “smart capital,” enjoying lower costs of debt and premium valuations on capital markets compared to carbon-intensive peers.
Companies in the green economy typically obtain access to cheaper capital Companies with green revenues can benefit both when raising equity and borrowing capital. They often enjoy better financing terms, including lower weighted average cost of capital (WACC).
BCG analysis found a correlation consistent across all industries that companies with green revenues secure a lower cost of capital at an average of~43 basis points (bps) less than companies without green revenues (see Figure 15 for detailed WACC discounts on selected industries) on page 26 of the report.
Notably, new debt financing vehicles often offer lower-cost financing to companies funding green projects (e.g. green bonds). A lower risk profile of companies in green markets can also justify a lower cost of debt. Leading financial institutions highlight that companies with access to cheaper capital can often generate higher share prices.
This means that secondary share issues and mergers and acquisitions transactions are less dilutive. A better valuation may support lower interest rates, lowering overall capital costs. As a result, companies with access to cheaper capital can invest in green growth opportunities more easily and efficiently – creating a virtuous cycle that improves revenues, overall financial performance and market valuations.
This is not a soft benefit. This is a hard financial advantage that compounds over time.
Lower cost of debt means that green economy operators can finance growth at lower rates than their conventional competitors. Over a five-year capital deployment cycle, that difference in financing cost translates directly into competitive advantage — the ability to bid more aggressively, invest more heavily, and scale faster than competitors who are paying higher rates for the same capital.
Premium valuations mean that when green economy operators access equity markets — whether through private investment rounds, strategic partnerships, or public markets — they are receiving higher multiples for the same earnings than carbon-intensive peers. That premium valuation is not just a paper gain. It is a real cost-of-capital advantage that affects every subsequent financing decision.
The organizations that understand this dynamic are not just building green businesses because they believe in the mission. They are building green businesses because the financial structure of the green economy is fundamentally more advantageous than the financial structure of conventional industry — and that advantage is growing, not shrinking, as regulatory pressure increases and capital markets continue to price carbon risk into valuations.
The BioEconomy Solutions “Industrial-Scale Biogenic Carbon Infrastructure” projects benefit directly from this capital market environment.
The Red Team View — What Could Go Wrong
Any honest analysis of a $5 trillion market opportunity has to include the failure modes. Here are the ones worth taking seriously.
Policy Reversal Risk: Green economy growth has been significantly accelerated by policy support — the IRA, the Green Deal Industrial Plan, and similar frameworks. Policy environments can change. Organizations that are building businesses entirely dependent on subsidy structures rather than underlying economic fundamentals are exposed to policy reversal risk in ways that operators with genuine cost competitiveness are not.
Certification Inflation: As the premium for certified sustainable materials grows, the pressure to dilute certification standards grows with it. The organizations that are building positions based on genuinely rigorous certification — not the minimum viable standard — are going to be better protected against the devaluation of weaker certifications.
Execution Gap: The shift from commitments to execution is real — but execution is hard. The green economy is full of organizations that have made compelling commitments and are struggling to deliver operational results. The capital that flows to this market is going to become increasingly sophisticated about distinguishing between organizations that can execute and organizations that can only communicate.
Supply Chain Concentration: As demand for certified sustainable feedstocks grows faster than supply, there is a real risk of supply chain concentration — a small number of verified suppliers controlling access to materials that large-scale green manufacturing requires. This is a risk for buyers and an opportunity for suppliers who move early to establish verified, scalable supply.
What This Means If You’re Building or Investing Right Now
Let’s bring this to ground level.
If you are a developer, operator, or capital allocator trying to figure out where to position over the next three to five years, the report points to a clear set of principles:
Move toward verification. The premium in this market is moving to certified, documented, verifiable performance. Whatever you are building — whether it is a material supply chain, an infrastructure project, or a manufacturing operation — the investment in rigorous certification and documentation is not a cost. It is a value creation activity.
Think supply chain, not technology. The technologies are largely proven. The supply chains that those technologies require at scale are still being built. The most durable positions in the green economy over the next five years are in the certified inputs, the industrial feedstocks, and the supply chain infrastructure — not in the technologies themselves.
Treat regulatory alignment as strategy. The organizations that are building regulatory navigation into their core operating model — rather than reacting to regulatory changes as they come — are going to have structural advantages in accessing capital, winning contracts, and operating in regulated markets.
Execute, don’t just commit. The market is done rewarding commitments. The $2 trillion in value creation between now and 2030 is going to flow to organizations that can demonstrate operational results — verified data, documented performance, scalable execution capacity.
The Bottom Line
The global green economy is a $5 trillion reality. It is growing at twice the rate of conventional industry. It is attracting premium capital at lower cost. And it is projected to add $2 trillion in additional value by 2030.
The era of climate commitments is over. The era of operational execution has begun.
The organizations that are going to capture disproportionate value in this market over the next five years are not the ones with the best sustainability reports. They are the ones with the best supply chains, the most rigorous certifications, the most verifiable performance data, and the most disciplined execution capacity.
The window is open. The supply chains are being built. The specifications are being written. The capital is moving.
The question is not whether the green economy is real. That question has been answered.
The question is whether you are positioned inside it — with verified assets, certified materials, and operational infrastructure — before the window closes.
Ready to Map Your Position in the Green Economy?
At BioEconomy Solutions, we work with operators, developers, and capital allocators who are building positions in the green economy infrastructure — in biomass supply chains, sustainable infrastructure, carbon sequestration assets, and certified material markets — before they become obvious.
If you are serious about understanding where your specific business, project, or capital fits inside the $5 trillion green economy — and you want a clear strategy mapped around your actual situation, not a generic framework — let’s talk and see if we are aligned.
The market is moving from commitments to execution. The operators who move now build positions that are very difficult to replicate in three years.
Book a strategy call with the BioEconomy Solutions team.
♻️ Share This Post
📢 Comment Below / What are your thoughts?
👉 Follow BioEconomy Solutions for more
🌍 If you found this helpful, “Join my newsletter for deeper insights”. Link in my featured section.
♻️ Repost if you believe profitable reforestation is the future.
👉 Learn More About: Paulownia “G.U.A.R.D.I.A.N. Framework™”: https://www.linkedin.com/pulse/guardian-sustainability-operating-system-bioeconomy-victor-garlington-2dcke/
👉 This Is How We Grow Paulownia: https://bioeconomy-solutions.kit.com/products/paulownia-growers-manual-bio-econom
📧 Email: Mail@BioEconomySolutions.com
📅 Book a consultation 📞call: www.BioEconomySolutions.com/bookcall
Source: WEF Report on Already a MultiTrillion-Dollar Market: CEO Guide to Growth in the Green Economy Dec 2025
#GreenEconomy #Sustainability #ESG #CapitalStrategy #GreenInfrastructure #Biomass #CarbonSequestration #IndustrialFeedstocks #ClimateEconomy #BioEconomySolutions
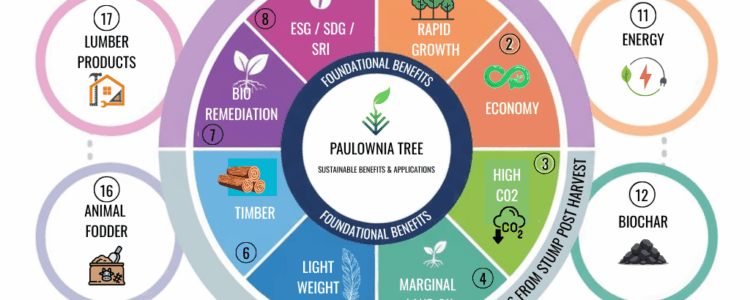
The G.U.A.R.D.I.A.N. Framework™
Growing sustainable biomass at scale
Unifying industry, farmers, and environment
Achieving net-zero operations
Regenerating degraded landscapes
Diversifying rural income streams
Integrating carbon credit economies
Accelerating climate solutions
Nurturing 35+ year supply chains
BioEconomy Solutions (BES) is pioneering the transition from extractive to regenerative industrial operations through The G.U.A.R.D.I.A.N. Framework™ https://www.linkedin.com/pulse/guardian-sustainability-operating-system-bioeconomy-victor-garlington-2dcke/

The G.U.A.R.D.I.A.N. Framework™ E-BOOK – 58pages