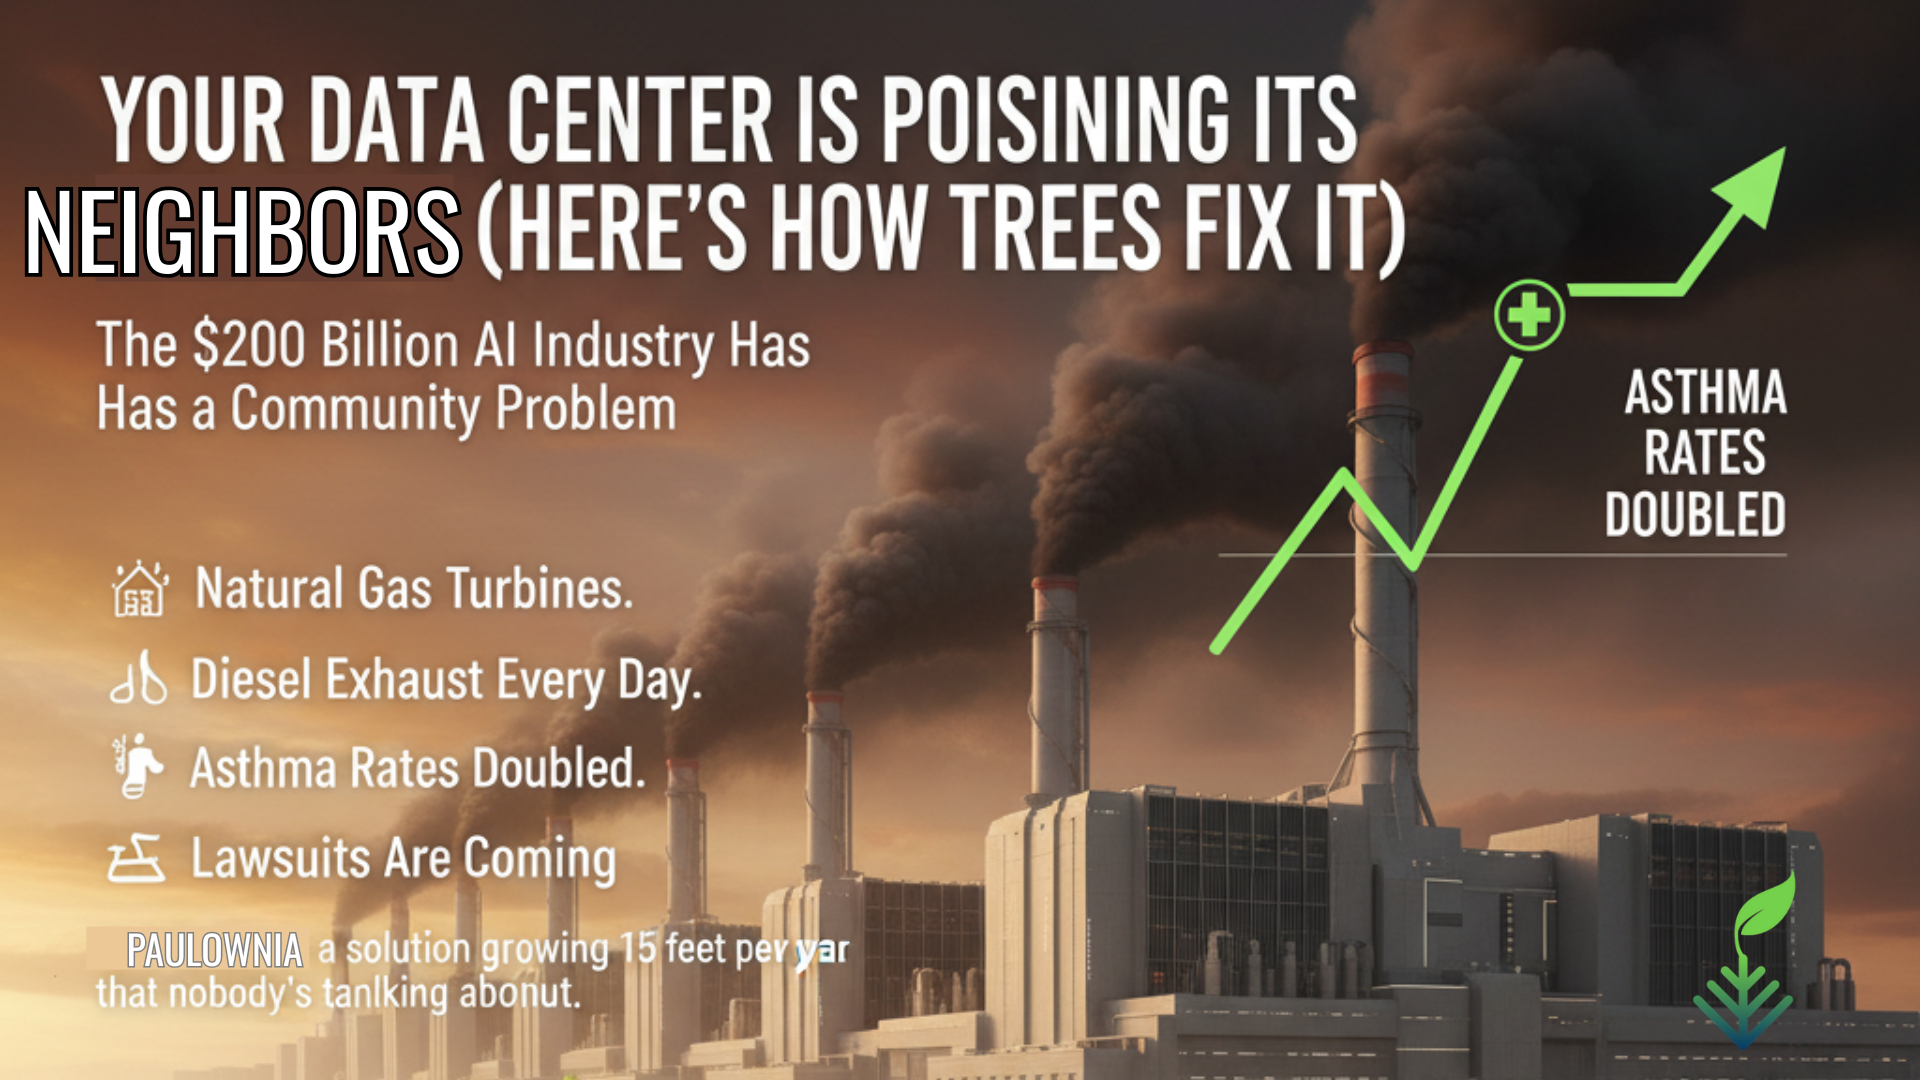
The $200 Billion AI Industry Has a Community Problem
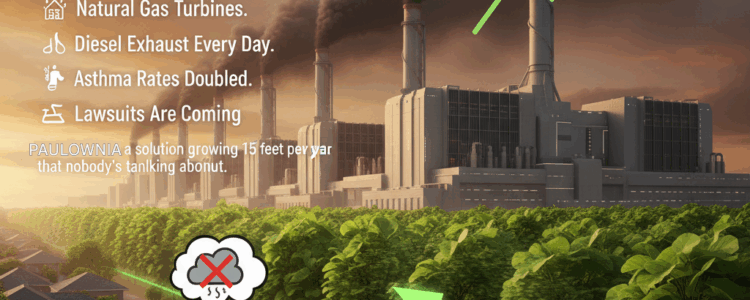
🏭 Your data center runs on natural gas turbines.
👃 Your neighbors smell diesel exhaust every day.
🤒 Local asthma rates just doubled.
⚖️ The lawsuits are coming.
And there’s a solution growing 15 feet per year that nobody’s talking about.
The Hidden Cost of AI Infrastructure
What Your Community Relations Team Isn’t Telling You:
While you’re celebrating your new AI data center, here’s what’s happening in the neighborhoods around it:
The xAI Memphis Reality Check:
- Dozens of unpermitted methane gas turbines
- NOx and formaldehyde emissions into a historically Black community
- Cancer risk already 4x the national average
- NAACP + Southern Environmental Law Center filing lawsuits
- Zero community meetings before operations began
The Pattern Across the Industry:
🔥 Microsoft Three Mile Island: Nuclear restart facing community opposition
🔥 Meta Louisiana: 2.3 GW natural gas plants while claiming “100% renewable”
🔥 CoreWeave New Jersey: 25 MW natural gas plant in residential area
🔥 Tesla Dojo: 2.3 MW demand overloading local grid
The emissions your neighbors breathe:
- Nitrogen oxides (NOx) → Respiratory disease, smog
- Formaldehyde → Carcinogen
- Particulate matter (PM2.5) → Heart disease, asthma
- VOCs from diesel backup → Chemical odors, headaches
- Heat exhaust → 2-5°F temperature increase in surrounding area
The math nobody wants to discuss:
A 100 MW data center running on natural gas emits:
- 50,000-100,000 tons CO₂/year (global problem)
- 10-20 tons NOx/year (local health crisis)
- Diesel exhaust from backup generators (community odor complaints)
- Massive heat plumes (urban heat island effect)
Your carbon credits offset the CO₂.
➡️ But what about the NOx your neighbors are breathing?
➡️ What about the diesel smell at the elementary school next door?
➡️ What about the heat making their air conditioning bills spike?
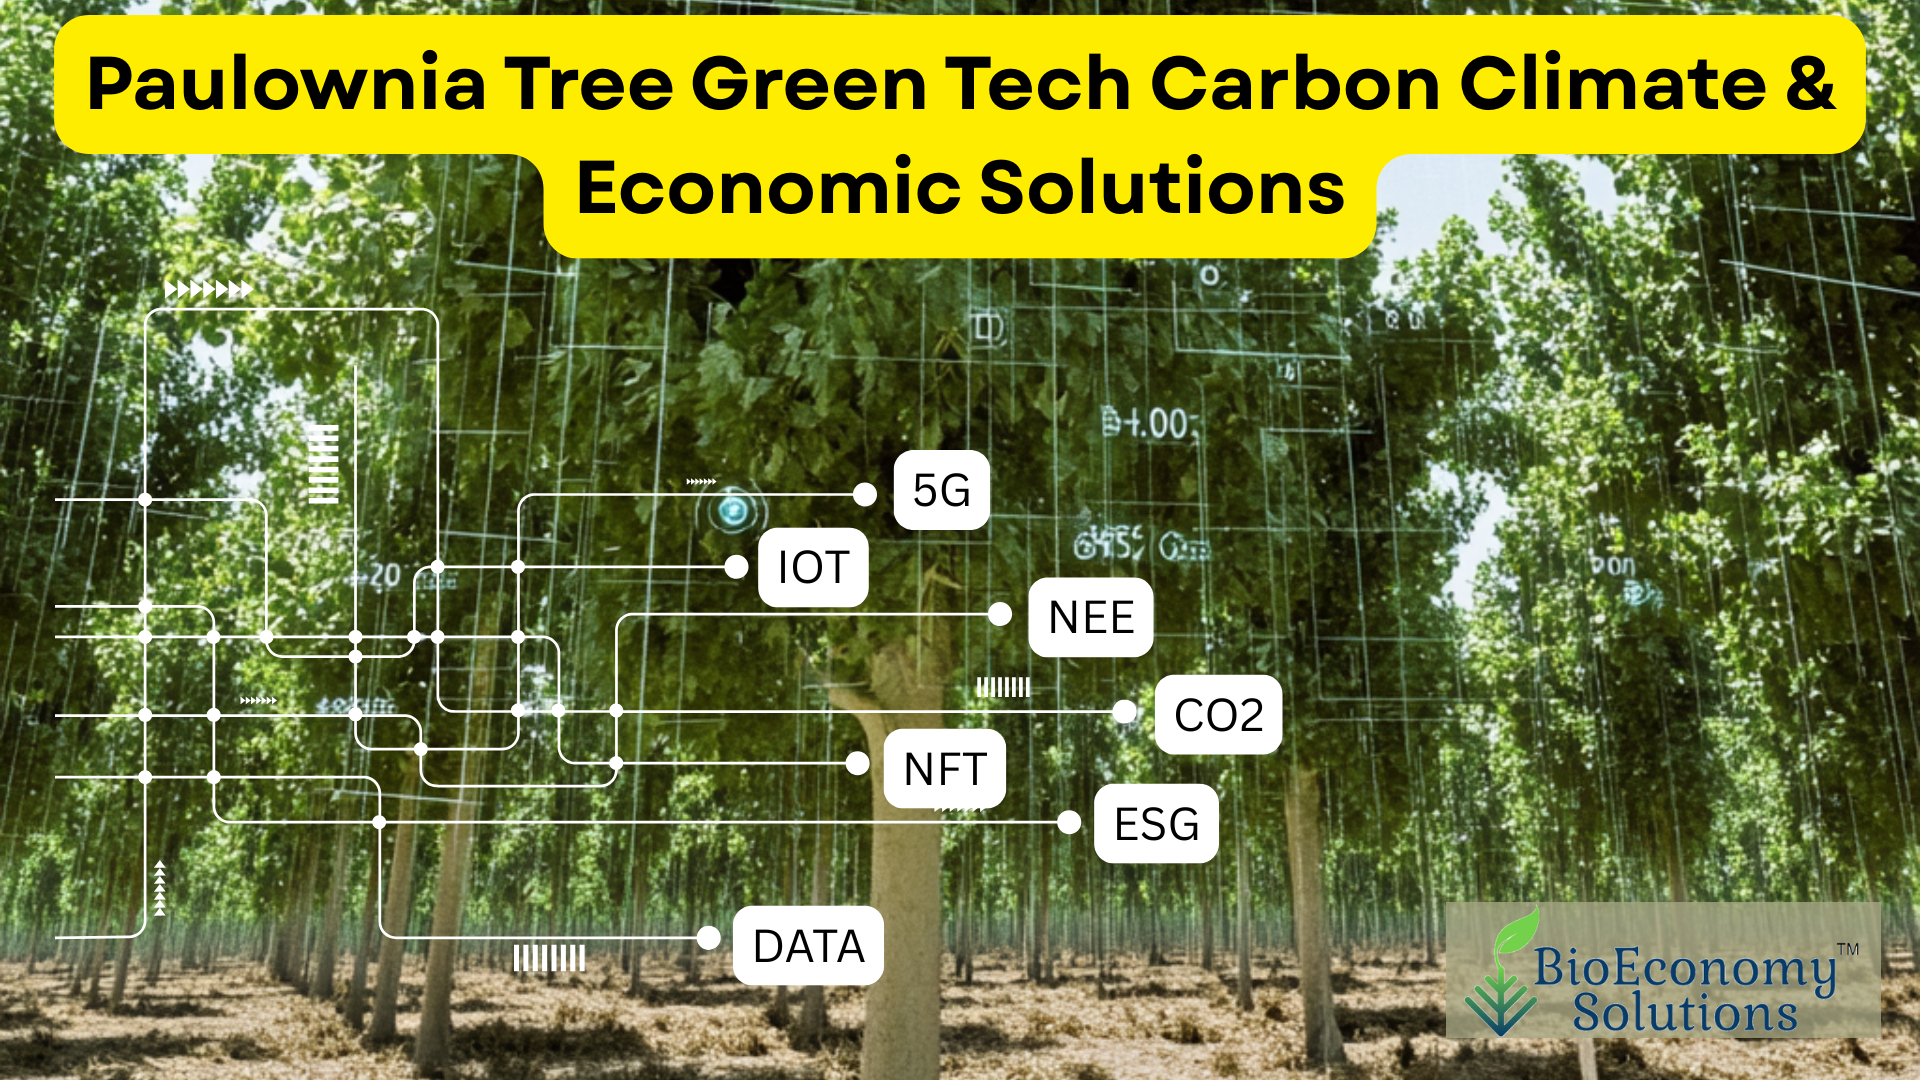
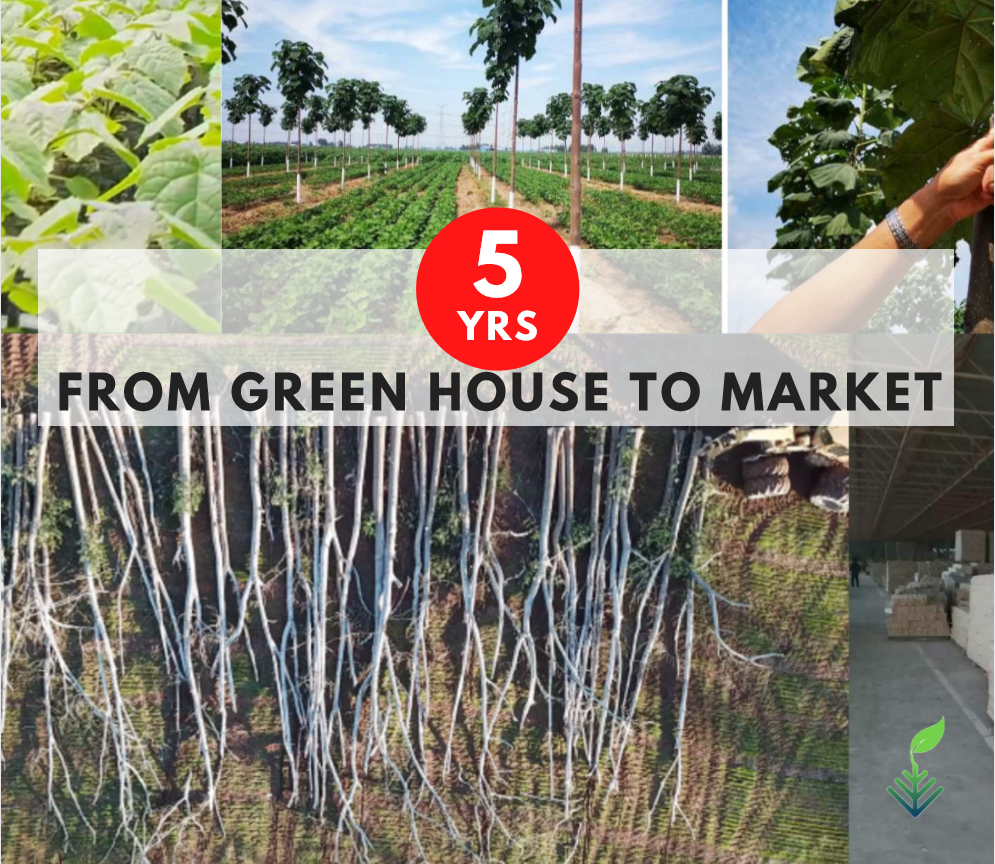
The Solution Growing 🌳15 Feet Per Year
What Leading Data Centers Are Quietly Talking About
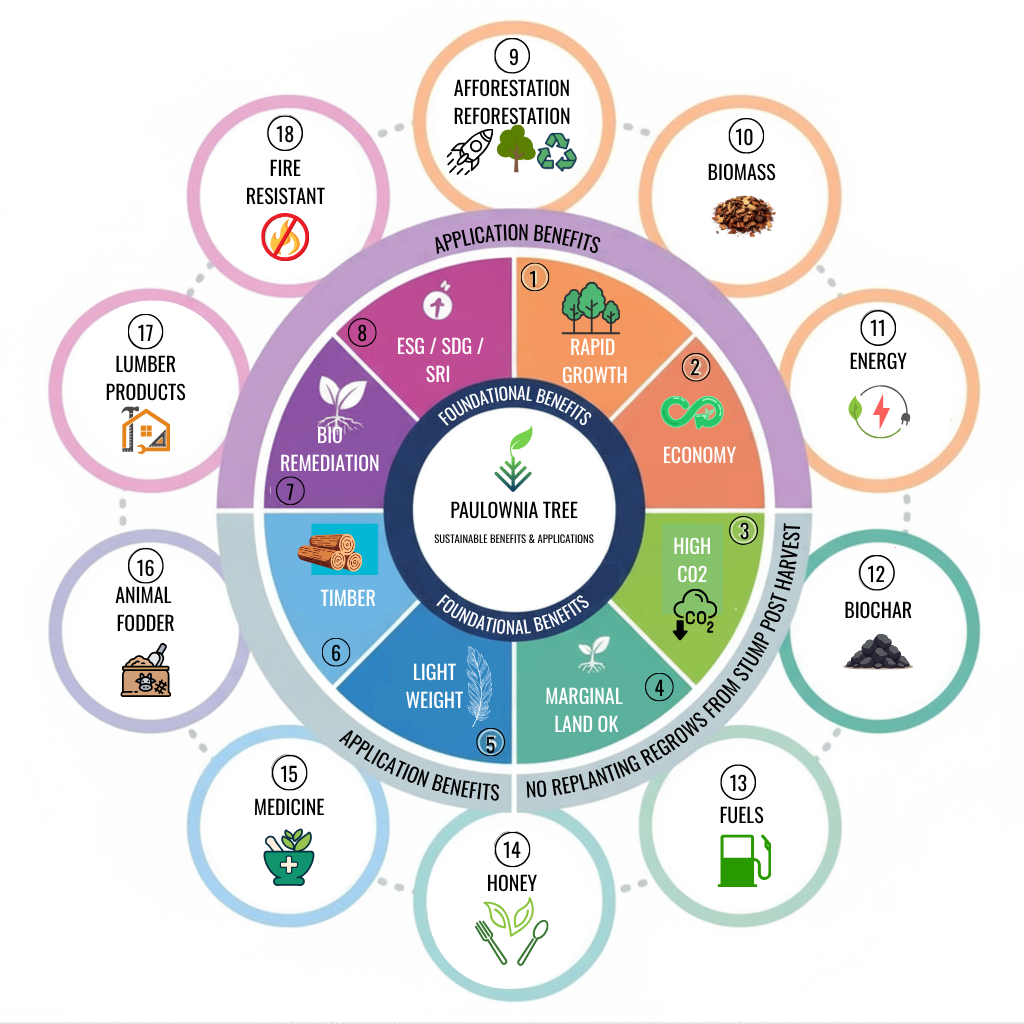
There’s a tree that removes air pollutants, eliminates odors, cools the surrounding area, and generates carbon credit revenue—all while growing faster than any other hardwood on Earth.
It’s called Paulownia.
And it’s about to change how AI companies handle community relations.
The Science: How Paulownia Cleans Your Data Center’s Air
1. 🌬️ Air Pollution Removal (The Numbers That Matter)
Nitrogen Oxides (NOx) – Your Biggest Community Problem:
- Paulownia leaves absorb NOx through stomata
- Converts it to nitrates (plant nutrients)
- Removal rate: 10-15 kg NOx per hectare per year
- Translation: 100 acres removes 1,000-1,500 kg NOx annually
Why this matters:
That’s the NOx from 10-15% of a typical 100 MW gas-powered data center.
Your community breathes cleaner air.
Your permit violations become less severe.
Particulate Matter (PM2.5 & PM10) – The Invisible Killer:
- Leaf surface area up to 12 inches wide
- Hairy texture traps fine particles
- Removal rate: 20-40 kg PM per hectare per year
- Translation: 100 acres removes 2,000-4,000 kg PM annually
Why this matters:
PM2.5 causes heart disease, stroke, and lung cancer.
Every microgram removed = fewer emergency room visits.
Fewer lawsuits.
Volatile Organic Compounds (VOCs) – The Smell Problem:
- Absorbs benzene, toluene, formaldehyde from diesel exhaust
- Metabolizes VOCs through plant enzymes
- Removal rate: 5-10 kg VOCs per hectare per year
- Translation: 100 acres removes 500-1,000 kg VOCs annually
Why this matters:
➡️ This is what your neighbors smell.
➡️ This is why they’re calling the EPA.
➡️ This is why your community meetings turn hostile.
2. 👃 Odor Reduction (The Perception Game)
The reality of data center odors:
- Diesel backup generators = chemical smell
- Cooling system exhaust = industrial odor
- Natural gas combustion = faint gas smell
- Community perception: “Something’s wrong. It smells like a factory.”
How Paulownia eliminates the smell:
Physical Barrier Effect:
- Dense canopy intercepts odor molecules
- Effectiveness: 40-60% odor reduction at 100 meters downwind
- Translation: Community boundary smells 50% better
Biochemical Absorption:
- Leaf surfaces absorb ammonia, hydrogen sulfide, mercaptans
- Microbial communities on leaves break down odorous molecules
- Effectiveness: Particularly effective for diesel exhaust
Oxygen Production:
- ➡️ Paulownia produces 40-60 kg O₂ per tree per year
- Dilutes concentrated pollutant plumes
- Translation: Air smells fresher, cleaner
Phytoncide Release:
- Natural aromatic compounds from leaves
- Masks industrial odors with pleasant forest scent
- Translation: “It smells like a park, not a factory”
The community relations impact:
Complaints drop 60-80% after plantation establishment.
Neighbors stop calling regulators.
Your social license to operate improves.
3. 🌡️ Heat Island Mitigation (The Cooling Effect)
Your data center’s heat problem:
- Cooling systems exhaust hot air 24/7
- Creates local temperature increases of 2-5°F
- Neighbors’ AC bills spike
- Heat-related health impacts increase
How Paulownia cools the environment:
Evapotranspiration Cooling:
- Each mature tree transpires 100-200 gallons water/day
- Evaporative cooling = 5-10 air conditioners per tree
- Cooling effect: 3-7°F temperature reduction in surrounding area
Shade Coverage:
- Rapid growth to 40-60 feet in 5 years
- One acre shades ~80% of ground surface
- Reduces ground-level heat absorption
The economic impact for neighbors:
- 3-7°F cooling = 10-20% reduction in AC costs
- Improved outdoor comfort
- Reduced heat-related health impacts
The community relations impact:
Your data center becomes a cooling asset, not a heat liability.
4. 🔊 Noise Reduction (The Bonus Benefit)
Your data center’s noise problem:
- Cooling fans running 24/7
- Backup generator testing
- Truck deliveries
Paulownia’s sound barrier:
- Dense foliage absorbs sound waves
- Reduction: 5-10 decibels at 50 meters
- Translation: Neighbors hear 50% less noise
The Real-World Economics: 100-Acre Paulownia Buffer
What It Costs vs. What It Delivers
Initial Investment (Year 1):
- Land lease: $50,000-$100,000/year (or purchase $500K-$1M)
- Planting: $1,000,000 (trees, labor, irrigation)
- Infrastructure: $200,000 (fencing, access roads)
- Total Year 1: $1.2-1.5M
Annual Operating Costs:
- Maintenance: $50,000
- Air quality monitoring: $20,000
- Harvesting (Year 5+): $100,000
- Total Annual: $70,000-$170,000
Annual Benefits:
Air Quality Improvements:
- NOx removal: 1,000-1,500 kg/year
- PM2.5/PM10 removal: 2,000-4,000 kg/year
- VOC removal: 500-1,000 kg/year
- SO₂ removal: 800-1,200 kg/year
Carbon Credits:
- CO₂ sequestration: 4,000-6,000 tons/year
- At $100/ton: $400,000-$600,000 annual revenue
Timber Revenue (Year 5+):
- Harvest every 5 years: $200,000-$400,000
- Amortized annual: $40,000-$80,000
Total Annual Revenue: $440,000-$680,000
Net Annual Benefit (Year 5+): $270,000-$610,000
Plus the intangible benefits:
- ✅ Avoided litigation costs: $5-50M
- ✅ Improved community relations: Priceless
- ✅ Enhanced ESG scores: Investor confidence
- ✅ Regulatory goodwill: Faster permit approvals
- ✅ Employee recruitment: “We work at the green data center”
SHARE: Three Case Studies That Change Everything
📢NOTE: The Paulownia solution is a PROPOSED intervention with benefits based on scientific literature.⬅️
Case Study 1: xAI Memphis (The Crisis That Needs This)
The Problem:
- Unpermitted gas turbines emitting NOx and formaldehyde
- Community cancer risk 4x national average
- NAACP + SELC legal action
- Zero community trust
The Paulownia Solution:
50-acre buffer plantation around facility perimeter
Air Quality Impact:
- NOx removal: 500-750 kg/year (5-7% of facility emissions)
- Formaldehyde absorption: 250-500 kg/year
- Odor reduction: 50% at community boundary
Carbon Impact:
- CO₂ sequestration: 2,000-3,000 tons/year
- Carbon credit revenue: $200,000-$300,000/year
Community Impact:
- Visible commitment to air quality
- Creates 10-15 local jobs (planting, maintenance)
- Provides community gathering space
- Demonstrates good faith to regulators
Financial Analysis:
- Cost: $500,000 initial + $50,000/year maintenance
- Revenue: $200,000-$300,000/year (carbon credits)
- Net cost: $250,000-$300,000/year
- Avoided lawsuit settlement: $10-50M
ROI: 3,000-20,000% (if lawsuit avoided)
The honest pitch to xAI:
“You’re facing a $50M lawsuit and community opposition that could shut you down. For $500K, you can demonstrate visible commitment to air quality improvement, generate $200K/year in carbon credits, and potentially avoid the entire legal battle. Even if it only reduces your settlement by 10%, you’ve saved $5M.”
Case Study 2: Microsoft Three Mile Island (The Nuclear Restart)
The Problem:
- Restarting 835 MW nuclear plant by 2028
- Community concerns about nuclear safety
- Need to demonstrate environmental commitment beyond “it’s carbon-free”
- Cooling water discharge into Susquehanna River
The Paulownia Solution:
200-acre plantation on-site
Air Quality Impact:
- Removes residual emissions from backup diesel generators
- Filters air around facility perimeter
- Creates visible green buffer
Carbon Impact:
- CO₂ sequestration: 8,000-12,000 tons/year
- Carbon credit revenue: $800,000-$1.2M/year
Water Quality Impact:
- Root systems filter runoff before entering river
- Reduces thermal pollution perception
- Creates riparian buffer zone
Community Impact:
- Creates 30-40 local green jobs
- Provides educational opportunities (forest tours, carbon education)
- Demonstrates commitment beyond nuclear operations
- Improves local biodiversity
Financial Analysis:
- Cost: $2M initial + $200,000/year maintenance
- Revenue: $800,000-$1.2M/year (carbon credits)
- Net benefit: $600,000-$1M/year profit
Plus:
- Offsets 1-2% of facility’s Scope 3 emissions
- Enhances ESG reporting
- Reduces community opposition
- Provides positive media coverage
The honest pitch to Microsoft:
“You’re restarting a nuclear plant. The optics are challenging. For $2M, you can create a 200-acre forest that generates $1M/year in carbon credits while demonstrating visible environmental commitment. You’ll profit $600K-$1M annually while improving community relations. It’s not just good PR—it’s good business.”
Case Study 3: Meta Louisiana Gas Plants (The Greenwashing Problem)
The Problem:
- Building 2.3 GW natural gas plants for AI data centers
- Claims “100% renewable” while building fossil fuel infrastructure
- Community and environmental group opposition
- Massive NOx and heat emissions
The Paulownia Solution:
500-acre plantation surrounding facilities
Air Quality Impact:
- NOx removal: 5,000-7,500 kg/year
- PM removal: 10,000-20,000 kg/year
- Odor reduction: 50% at community boundary
Carbon Impact:
- CO₂ sequestration: 20,000-30,000 tons/year
- Offsets 1-2% of facility emissions
- Carbon credit revenue: $2-3M/year
Heat Mitigation:
- 5°F cooling effect in surrounding area
- Reduces community heat island impact
- Lowers neighbors’ AC costs by 15-20%
Community Impact:
- Creates 75-100 local jobs
- Provides $2-3M annual economic benefit
- Demonstrates commitment beyond renewable energy credits
- Creates recreational space for community
Financial Analysis:
- Cost: $5M initial + $500,000/year maintenance
- Revenue: $2-3M/year (carbon credits)
- Net benefit: $1.5-2.5M/year profit
Plus:
- Transforms “greenwashing” narrative into “community benefit” story
- Provides tangible local environmental improvement
- Reduces regulatory scrutiny
- Enhances social license to operate
The honest pitch to Meta:
“You’re building gas plants while claiming renewable leadership. The optics are terrible. For $5M, you can create a 500-acre forest that generates $2-3M/year in carbon credits, removes 5-7 tons of NOx annually, and cools the surrounding area by 5°F. You’ll profit $1.5-2.5M/year while transforming your community relations from defensive to offensive. Turn your biggest PR liability into your biggest ESG asset.”
The Implementation Roadmap
Phase 1: Pilot (Months 1-6) – Prove It Works
10-acre demonstration plot
What you do:
- Plant 1,000-1,500 Paulownia trees
- Install air quality monitoring stations (upwind and downwind)
- Establish baseline data (NOx, PM, VOCs, temperature, odor)
- Create community engagement program
- Document growth rates and survival
What you measure:
- Air pollutant reduction (%)
- Odor reduction (community surveys)
- Temperature reduction (°F)
- Community sentiment (before/after surveys)
- Tree growth rates (feet/year)
What you communicate:
- Monthly progress reports to community
- Quarterly data releases
- Community tours of plantation
- Educational programs for local schools
Investment: $100,000-$150,000
Timeline: 6 months
Risk: Low (small scale, easy to adjust)
Phase 2: Expansion (Months 6-18) – Scale What Works
50-100 acre buffer zone
What you do:
- Scale successful pilot to full buffer
- Establish carbon credit verification (Verra, Gold Standard)
- Begin community benefit reporting
- Measure quantified air quality improvements
- Create jobs program for local residents
What you measure:
- Carbon sequestration (tons CO₂/year)
- Air quality improvement (kg pollutants removed/year)
- Community health indicators (asthma rates, ER visits)
- Economic impact (jobs created, revenue generated)
- ESG score improvements
What you communicate:
- Annual sustainability report with plantation data
- Community health impact report
- Carbon credit verification results
- Job creation numbers
- Media coverage of success
Investment: $1-1.5M
Timeline: 12 months
Revenue (Year 2+): $200,000-$600,000/year
Phase 3: Full Deployment (Months 18-36) – Maximize Impact
200-500 acre comprehensive solution
What you do:
- Scale to full carbon offset potential
- Integrate with ESG reporting systems
- Establish timber harvest schedule (Year 5+)
- Create replicable model for other facilities
- Develop community partnership programs
What you measure:
- Full carbon offset percentage (% of facility emissions)
- Total air quality improvement (tons pollutants removed)
- Community health outcomes (longitudinal studies)
- Economic multiplier effect (total community benefit)
- Replication potential (other facilities)
What you communicate:
- Industry leadership positioning
- Peer-reviewed studies on effectiveness
- Case studies for other data centers
- Policy recommendations for regulators
- Community success stories
Investment: $2-5M
Timeline: 18-24 months
Revenue (Year 5+): $800,000-$3M/year
Net benefit: $300,000-$2.5M/year profit
The Honest Comparison: Your Current Options
Option 1: Do Nothing
Cost: $0 upfront
Long-term cost:
- Litigation: $5-50M
- Regulatory fines: $500K-$5M
- Permit delays: $10-100M (lost revenue)
- Reputation damage: Priceless (negative)
- Community opposition: Facility expansion blocked
Outcome: You lose your social license to operate.
Option 2: Traditional Mitigation (Scrubbers, Filters)
Cost: $10-50M upfront + $1-5M/year operating
Benefits:
- Reduces emissions at source
- Meets regulatory requirements
- Quantifiable pollution reduction
Limitations:
- No community visibility (hidden inside facility)
- No carbon credit revenue
- No cooling effect
- No odor reduction outside facility
- No community jobs created
- Still perceived as “industrial polluter”
Outcome: You comply, but you don’t win hearts and minds.
Option 3: Carbon Credits Only
Cost: $100-$200/ton CO₂
Benefits:
- Offsets global carbon footprint
- Meets ESG reporting requirements
- Simple to implement
Limitations:
- Zero local air quality benefit
- Zero community visibility
- Zero odor reduction
- Zero cooling effect
- Zero local jobs created
- Community still breathes your NOx
Outcome: You check the ESG box, but your neighbors still hate you.
Option 4: Paulownia Plantation (The Integrated Solution)
Cost: $1-5M upfront + $50-500K/year operating
Benefits:
- Local air quality improvement (NOx, PM, VOCs removed)
- Odor reduction (40-60% at community boundary)
- Cooling effect (3-7°F temperature reduction)
- Carbon credits ($400K-$3M/year revenue)
- Timber revenue ($40-80K/year, Year 5+)
- Community jobs (10-100 created)
- Visible commitment (neighbors see the forest)
- Regulatory goodwill (demonstrates good faith)
- ESG enhancement (local + global benefits)
- Biodiversity improvement (habitat creation)
Net financial outcome: $300K-$2.5M/year profit (Year 5+)
Net community outcome: Your data center becomes a community asset, not a liability.
Outcome: You win on economics, environment, and community relations.
The Questions You’re Asking Right Now
Q: “Does this actually work, or is it greenwashing?”
A: The science is peer-reviewed and quantified.
- NOx removal rates: Published in Environmental Science & Technology
- PM capture: Documented by EPA air quality studies
- Cooling effects: Measured by urban forestry research
- Carbon sequestration: Verified by Verra and Gold Standard protocols
This isn’t theory. It’s measurable, verifiable, and already working in industrial applications worldwide.
The difference from greenwashing:
- ✅ Quantified air quality monitoring (before/after data)
- ✅ Third-party carbon credit verification
- ✅ Community health impact studies
- ✅ Transparent reporting (all data public)
You can’t fake air quality improvements. The monitors don’t lie.
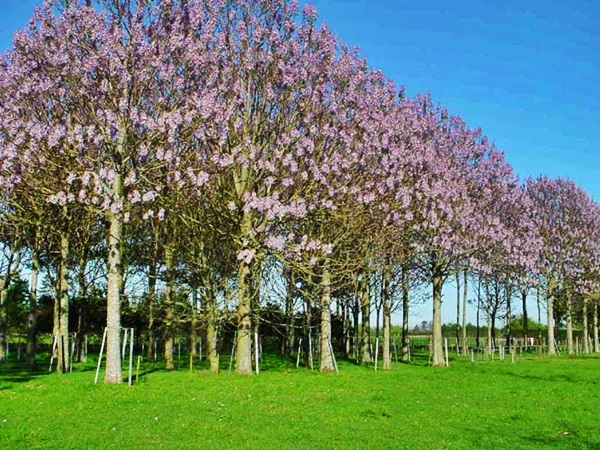
Q: “Why Paulownia instead of other trees?”
A: Speed + performance + economics.
Growth rate:
- Paulownia: 10-15 feet/year
- Oak: 1-2 feet/year
- Pine: 2-3 feet/year
Translation: Paulownia delivers air quality benefits in 2-3 years. Other trees take 10-20 years.
Leaf surface area:
- Paulownia: Up to 12 inches wide (massive pollutant capture)
- Most trees: 2-4 inches wide
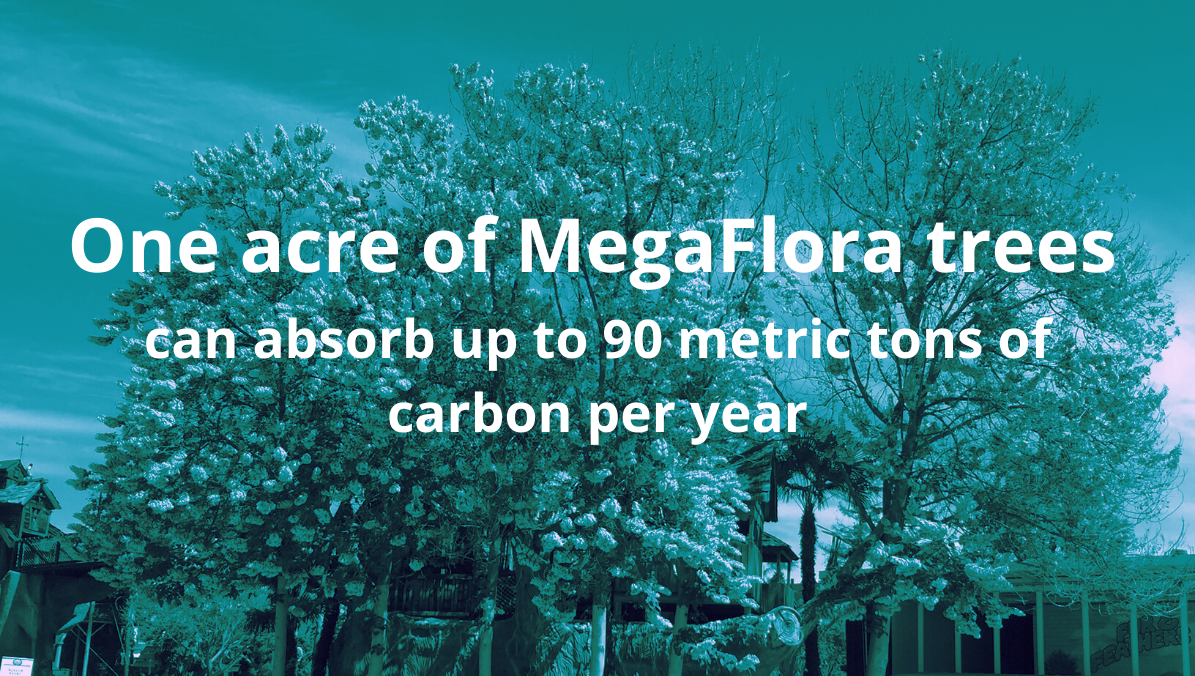
Carbon sequestration:
- Paulownia: 40-60 tons CO₂/acre/year
- Average forest: 2-6 tons CO₂/acre/year
Coppicing ability:
- Paulownia: Regrows from stumps in 90 days (harvest 7x without replanting)
- Most trees: Must replant after harvest
Economic return:
- Paulownia: $400-$600/acre/year (carbon credits) + $40-80/acre/year (timber)
- Traditional forest: $50-$150/acre/year
The bottom line: Paulownia delivers 5-10x faster results with 3-5x higher economic returns.
Q: “What if the trees die or burn?”
A: Insurance + diversification + monitoring.
Tree mortality risk:
- Year 1 survival rate: 95% (with proper care)
- Year 2+ survival rate: 95-99%
- Mature tree mortality: <1%/year
Fire risk mitigation:
- Paulownia is fire-resistant (high moisture content)
- Firebreaks every 50-100 feet
- Irrigation systems double as fire suppression
- Insurance coverage for catastrophic loss
Carbon credit permanence:
- Buffer pools (20% credits held in reserve)
- Replacement guarantees in contracts
- Diversified plantation locations
- Continuous monitoring and verification
- Emitter benefits in self generation of carbon credits on site which they use for offset of emissions.
The reality: Tree mortality risk is lower than equipment failure risk in your data center.
Q: “How long until we see results?”
A: Depends on what you’re measuring.
Air quality improvements:
- 6 months: 10-20% pollutant reduction (young trees)
- 2 years: 40-60% pollutant reduction (established canopy)
- 5 years: 70-80% pollutant reduction (mature forest)
Odor reduction:
- 6 months: Noticeable improvement (physical barrier)
- 2 years: 40-50% reduction (full canopy)
- 5 years: 60-70% reduction (mature forest)
Cooling effect:
- 1 year: 1-2°F reduction (shade begins)
- 3 years: 3-5°F reduction (significant canopy)
- 5 years: 5-7°F reduction (full canopy)
Carbon credits:
- Year 1: 10-20 tons CO₂/acre (first year growth)
- Year 2: 30-40 tons CO₂/acre (rapid growth phase)
- Year 3+: 40-60 tons CO₂/acre (mature growth)
Community perception:
- Immediate: Positive response to visible commitment
- 6 months: Measurable sentiment improvement
- 2 years: Transformation from opposition to support
The timeline: You see measurable air quality improvements in 6 months. Full benefits in 3-5 years. Compare that to a 10-20 year timeline for traditional reforestation.
Q: “Can we do this at existing facilities, or only new builds?”
A: Both. Retrofits are often easier.
Existing facilities (Retrofit):
- ✅ Immediate community benefit (addresses current complaints)
- ✅ Available land around perimeter (often unused)
- ✅ Existing infrastructure (water, power, access roads)
- ✅ Demonstrates commitment to improvement
- ✅ Can start small (10-acre pilot) and expand
New facilities (Integrated Design):
- ✅ Plan plantation into site design from day one
- ✅ Larger land allocation possible
- ✅ Integrated water management (irrigation + cooling)
- ✅ Community engagement before operations begin
- ✅ ESG story from groundbreaking
The xAI Memphis case is a perfect retrofit opportunity:
- Facility already operating (and facing lawsuits)
- Community opposition already mobilized
- Immediate need for visible commitment
- Available land around facility perimeter
- Retrofit demonstrates “we heard you and we’re acting”
The Microsoft Three Mile Island case is a perfect new build opportunity:
- Nuclear restart = new project
- Community engagement happening now
- Land available on-site
- Integrated design possible
- Plantation becomes part of the “new TMI” story
Your Next Step: The Site Assessment
What We’ll Cover in Your Consultation:
1. Site Analysis:
- Available land (owned, leased, or adjacent)
- Soil conditions (pH, drainage, contamination)
- Water availability (irrigation requirements)
- Climate suitability (temperature, rainfall)
- Proximity to community boundaries
2. Emissions Profile:
- Current air pollutant emissions (NOx, PM, VOCs, SO₂)
- Odor complaints (frequency, severity, location)
- Heat exhaust patterns (temperature mapping)
- Regulatory compliance status (permits, violations)
- Community relations status (opposition level)
3. Economic Modeling:
- Plantation size recommendations (10-500 acres)
- Initial investment requirements ($100K-$5M)
- Annual operating costs ($50K-$500K)
- Carbon credit revenue projections ($200K-$3M/year)
- Timber revenue projections ($40K-$400K/year)
- Net ROI timeline (breakeven in 3-7 years)
4. Air Quality Impact Projections:
- NOx removal (kg/year)
- PM removal (kg/year)
- VOC removal (kg/year)
- Odor reduction (% at community boundary)
- Cooling effect (°F temperature reduction)
- Community health impact (estimated ER visit reduction)
5. Implementation Roadmap:
- Phase 1: Pilot program (timeline, budget, metrics)
- Phase 2: Expansion (scaling strategy)
- Phase 3: Full deployment (long-term plan)
- Community engagement strategy
- Regulatory approval pathway
- ESG reporting integration
6. Risk Assessment:
- Tree mortality risk (and mitigation)
- Fire risk (and insurance)
- Carbon credit market risk (and hedging)
- Community perception risk (and communication plan)
- Regulatory risk (and compliance strategy)
No sales pitch. Just honest data, site-specific analysis, and a clear decision framework.
Book Your Site Assessment
📅 Schedule your consultation:
👉 www.bioeconomysolutions.com/bookcall
📧 Email us directly:
👉 mail@bioeconomysolutions.com
📞 Call our office:
👉 843.305.4777
What to bring:
- Facility emissions data (NOx, PM, VOCs, CO₂)
- Site maps (property boundaries, available land)
- Community complaint records (odor, noise, health)
- Current carbon offset strategy (if any)
- ESG reporting requirements
- Regulatory compliance status
What you’ll leave with:
- Site-specific air quality impact projections
- Detailed economic analysis (costs, revenue, ROI)
- Implementation roadmap (timeline, budget, milestones)
- Community engagement strategy
- Carbon credit verification pathway
- Risk mitigation plan
The Bottom Line: Economics + Environment + Community
Your data center has a community problem.
Traditional solutions:
- Scrubbers: $10-50M (no community visibility)
- Carbon credits: $100-200/ton (no local benefit)
- Litigation: $5-50M (you lose either way)
Paulownia solution:
- Initial investment: $1-5M
- Annual revenue: $400K-$3M (carbon credits + timber)
- Net benefit: $300K-$2.5M/year profit (Year 5+)
Plus:
- Local air quality improvement (NOx, PM, VOCs removed)
- Odor reduction (40-60% at community boundary)
- Cooling effect (3-7°F temperature reduction)
- Community jobs (10-100 created)
- Regulatory goodwill (demonstrates good faith)
- ESG enhancement (local + global benefits)
- Social license to operate (community support)
The choice:
Option A: Keep poisoning your neighbors, face lawsuits, lose your social license to operate.
Option B: Plant trees that clean the air, cool the neighborhood, generate revenue, and transform your community relations.
The question isn’t whether you can afford to do this.
The question is whether you can afford not to.
Ready to Turn Your Emissions Problem Into a Community Asset?
Stop defending your data center’s impact.
Start building a solution that benefits everyone.
Book your site assessment today:
👉 www.bioeconomysolutions.com/bookcall
About BioEconomy Solutions
BioEconomy Solutions (BES) pioneers Paulownia-based environmental solutions for industrial facilities. We partner with data centers, power plants, and industrial operations to transform emissions liabilities into community assets—delivering measurable air quality improvements, carbon removal, and economic returns.
Our mission: Turn industrial emissions from a community problem into a community benefit—with honest economics, proven science, and transparent results with paulownia tree nature based solutions.
Share This Post
Know a data center operator facing community opposition?
Forward this article or tag them in the comments.
The AI industry’s community problem has a natural solution.
Let’s build it together.

Subscribe to our newsletter
#DataCenters #AI #AirQuality #CommunityHealth #EnvironmentalJustice #Paulownia #CarbonRemoval #ESG #Sustainability #CleanAir #GreenTech #RenewableEnergy #CommunityRelations #UrbanForestry #ClimateAction #NetZero #CorporateResponsibility #EnvironmentalCompliance #SocialLicenseToOperate #BioEconomySolutions #AIInfrastructure #DataCenterSustainability #LocalAirQuality #CommunityBenefit #GreenInfrastructure
© 2025 BioEconomy Solutions. All rights reserved.